Welcome to the App for I-DE Clients
Iberdrola Distribución Eléctrica is now i-DE. A new name, but with the same quality, experience and reliability.
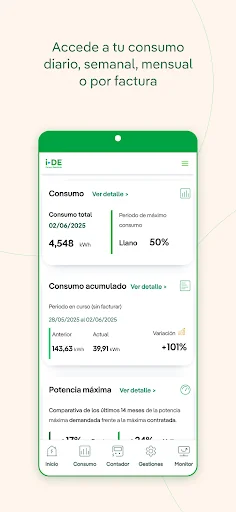
Here you can see your energy consumption, the power you are using or know the time that light will take to return if there is a fault or programmed cut that affects you, in the simplest, fastest and most intuitive way.
At any time and anywhere you can, in one click, have all the information you need to get the most out of your connection to…
Iberdrola Distribución Eléctrica is now i-DE. A new name, but with the same quality, experience and reliability.
Here you can see your energy consumption, the power you are using or know the time that light will take to return if there is a fault or programmed cut that affects you, in the simplest, fastest and most intuitive way.
At any time and anywhere you can, in one click, have all the information you need to get the most out of your connection to the smart grid
WITH THE CUSTOMERS APP YOU CAN:
● View your daily, weekly, monthly consumption, by invoices or a specific period.
● Download detailed information about your consumption in Excel, CSV or PDF.
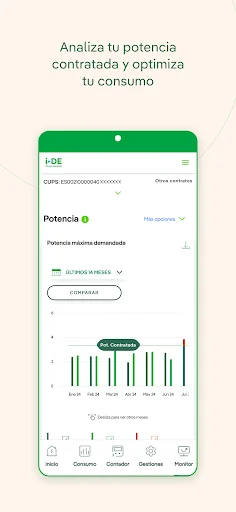
● Check if the power you have contracted is adequate by looking at a graph the maximum power demanded and the power contracted.
● Manage contracts of other clients.
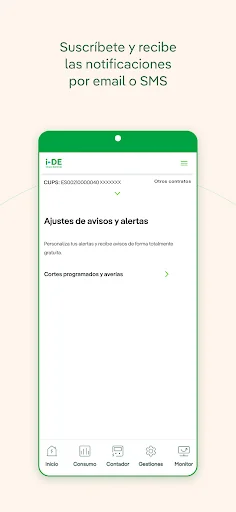
● Know if there is a fault that affects you or a cut scheduled for maintenance tasks and improvement of the network. We notify you by SMS or by email.
Also, if you are a "direct toll" customer:
● Subscribe to the electronic invoice.
● View and download your toll invoices.
AND SOON, YOU WILL BE ABLE TO MAKE MUCH MORE ...
Our App evolves constantly, and soon you can count on new features, such as ...
● Send questions
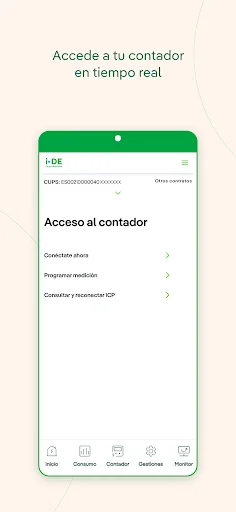
● Perform power measurements, both instantaneously and over a period of time.
● Download consumption and reading certificates.
● Reconnect your power control switch (ICP) if it has tripped due to an overload.
● Request the registration of a new supply
● Report possible fraud.
● And if you still do not have Smart Counter, record a counter measurament.
WHAT IS i-DE?
i-DE is the electricity distributor of the Iberdrola Group in Spain and we are responsible for bringing electricity through our networks to your home and for maintaining the network so that you have good quality power supply.
https://www.i-de.es/conozcanos
MORE INFORMATION
Visit our website: https://www.i-de.es
Comparable Android apps
The five apps in Tools with the closest revenue to i-DE. Click any to see its detail page.
Each forecast combines App Store rating, ratings count, monetisation model, pricing tier, IAP signals and ad-supported flag.
The base estimate is then multiplied by a per-category scaling factor learned from apps with founder-verified MRR.
Every number on this page comes from public APIs and Bumetric's own snapshot history.
Full methodology covers input variables, accuracy bands per category and how we treat apps without comparable anchors.
See also the live data on i-DE's tracker page for current rating, reviews and snapshot timeline.
Building something similar? Get a free AI audit with $-revenue forecasts for every recommendation.


 Mahadhan: Farmers
 Image Converter - JPG/PNG/PDF
 ZFlasher STM32
 Dont Touch My Phone
 Massager - Vibrator