Android app
from Preferred Hotels
· Travel & Local
ML forecast★ 2.9 · 318Free
~284/mo
ML revenue forecast.
Calibrated against 30046 apps in this category.
Confidence band
±15%
High — many comparable apps with verified data
At a glance
Earns 1.83× more than the category median (155/mo).
Ranks #5,508 of 30,046 in Travel & Local (top 18.3% by revenue).
Launched Apr 03, 2017.
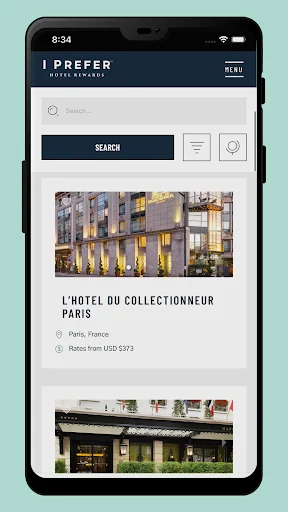
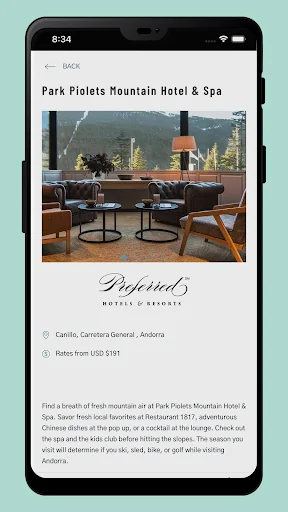
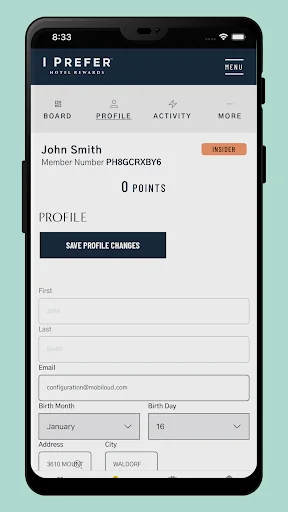
What the app looks like
Live screenshots from the Play Store, captured by our snapshot worker. Tap any image to enlarge.
I Prefer's revenue trajectory
Forecast revenue from snapshot history. Last 1 months.
Where I Prefer sits in Travel & Local
Revenue distribution of 30046 comparable apps. I Prefer highlighted.
I Prefer vs comparable apps
Revenue trajectory side-by-side. Bold = I Prefer, ghosted = peers.
App spec
Version
Varies with device
Launched
Apr 03, 2017
Price
Free
Monetization
Free
What I Prefer actually does (from store listing)
The World Awaits
Your next rewarding trip starts here.
With the official I Prefer Hotel Rewards app, you can easily explore and book stays at more than 650 distinctive hotels and resorts around the world, manage your Member account, and access exclusive rates and offers.
Features
Discover and book hotels with great rates and exclusive offers
View upcoming reservations, past stays, and points activity
Redeem points for rewards, including free nights and more
Manage…
With the official I Prefer Hotel Rewards app, you can easily explore and book stays at more than 650 distinctive hotels and resorts around the world, manage your Member account, and access exclusive rates and offers.
Features
Discover and book hotels with great rates and exclusive offers
View upcoming reservations, past stays, and points activity
Redeem points for rewards, including free nights and more
Manage your Member account and personal information
Save your favorite destination for yourself or to share with friends
Not a Member of I Prefer Hotel Rewards?
Enroll free today to enjoy Members-only hotel offers and instant travel benefits including:
Points Earned on Eligible Stays
Early Check-in & Late Check-out
Exclusive Rates & Offers
Complimentary Wi-Fi
Enhanced Room Upgrades
Comparable Android apps
The five apps in Travel & Local with the closest revenue to I Prefer. Click any to see its detail page.
Each forecast combines App Store rating, ratings count, monetisation model, pricing tier, IAP signals and ad-supported flag.
The base estimate is then multiplied by a per-category scaling factor learned from apps with founder-verified MRR.
Every number on this page comes from public APIs and bumetric's own snapshot history.
Full methodology covers input variables, accuracy bands per category and how we treat apps without comparable anchors.
See also the live data on I Prefer's tracker page for current rating, reviews and snapshot timeline.
Building something similar? Get a free AI audit with $-revenue forecasts for every recommendation.

 Sesame Place
 Traveling.com
 St Petersburg Metro Guide
 와이파이도시락
 福容大飯店-會員特惠及福星獎勵