ML revenue forecast.
Calibrated against 22864 apps in this category.
Confidence band
±15%
High — many comparable apps with verified data
At a glance
Earns 2.39× more than the category median (162/mo).
Ranks #3,397 of 22,864 in Communication (top 14.9% by revenue).
Launched Mar 31, 2020 · last updated Dec 10, 2025.
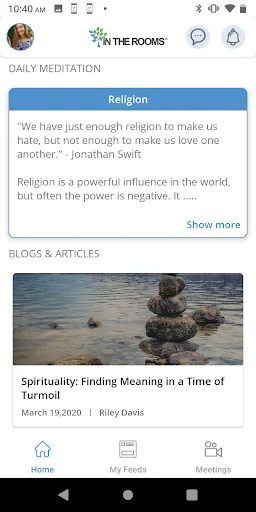
What the app looks like
Live screenshots from the Play Store, captured by our snapshot worker. Tap any image to enlarge.
In The Rooms's revenue trajectory
Forecast revenue from snapshot history. Last 1 months.
Where In The Rooms sits in Communication
Revenue distribution of 22864 comparable apps. In The Rooms highlighted.
In The Rooms vs comparable apps
Revenue trajectory side-by-side. Bold = In The Rooms, ghosted = peers.
App spec
Version
3.5
Last update
Dec 10, 2025
Launched
Mar 31, 2020
Price
Free
Monetization
Free
What In The Rooms actually does (from store listing)
In The Rooms App
In The Rooms is a free, digital meeting website and social network for the addiction recovery community. With over 600,000 members, In The Rooms provides a virtual space for people to connect with others in recovery around the globe. Our community offers support for those in recovery from alcohol or drug addiction, as well as behavioral addictions such as love and relationships, sex and gambling. Our newly-redesigned app gives you recovery at your fingertips, with easy access…
In The Rooms is a free, digital meeting website and social network for the addiction recovery community. With over 600,000 members, In The Rooms provides a virtual space for people to connect with others in recovery around the globe. Our community offers support for those in recovery from alcohol or drug addiction, as well as behavioral addictions such as love and relationships, sex and gambling. Our newly-redesigned app gives you recovery at your fingertips, with easy access to virtual meetings, social networking tools, blogs, and recovery guides.
Redesigned Interface
Experience a fresh new layout that brings all our most popular features to the forefront.
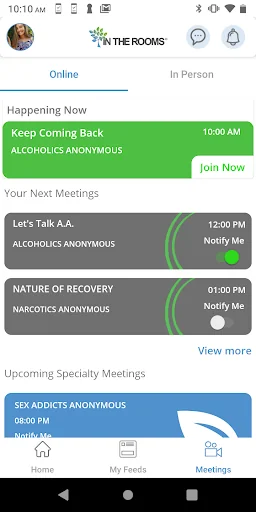
Virtual Meetings
Take part in over 130 live meetings per week (including AA, NA and other fellowships) to supplement your in-person recovery meetings. Turn on your camera and share with the group, or just observe, then mark your attendance if you need verification of your presence in the meeting.
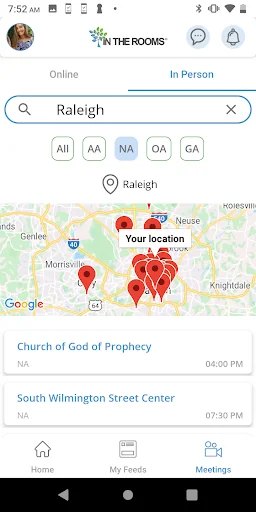
In-Person Meeting Finder
Find face-to-face meetings in your geographic area.
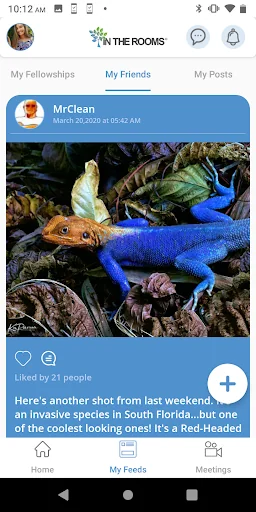
Newfeeds & Chats
Start the conversation – post an update in the status feed, create a discussion in your fellowship or chat one-on-one with a friend.
Blogs & Recovery Guides
Check out our selection of the latest recovery news, perspectives and recommendations, or explore our guides for those just getting started in recovery.
Privacy
On In The Rooms, members can remain as anonymous as they wish.
Comparable Android apps
The five apps in Communication with the closest revenue to In The Rooms. Click any to see its detail page.
Each forecast combines App Store rating, ratings count, monetisation model, pricing tier, IAP signals and ad-supported flag.
The base estimate is then multiplied by a per-category scaling factor learned from apps with founder-verified MRR.
Every number on this page comes from public APIs and bumetric's own snapshot history.
Full methodology covers input variables, accuracy bands per category and how we treat apps without comparable anchors.
See also the live data on In The Rooms's tracker page for current rating, reviews and snapshot timeline.
Building something similar? Get a free AI audit with $-revenue forecasts for every recommendation.

 Teleuniverso
 Twiq - Anonymous Chat
 HablaCuba - Cubacel and More
 Spark Voicemail
 Text Reader: Text to Voice