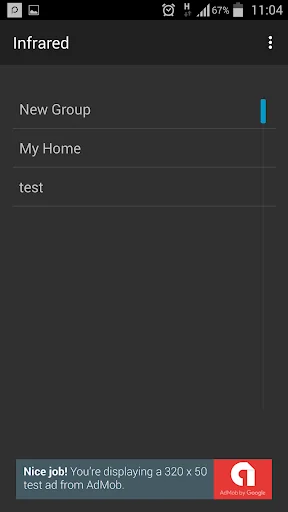
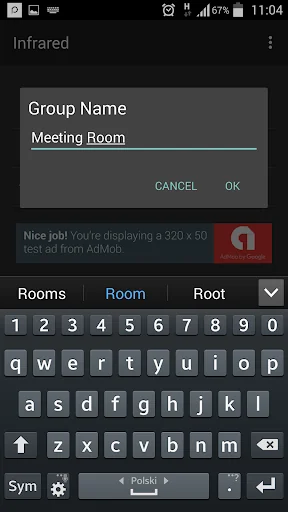
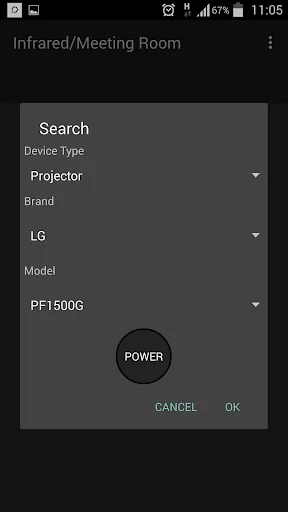
Supported Device Types
AV System
Blu Ray
Air Conditioner
CD/DVD/VCR
Home Theatre System
IPod
Media Manager
Projector
Set Top Box
Soundbar
TV
Aux
Receiver/Preamp
Other
Subwoofer
Tuner
Switcher
Supported Brand List
10Moons
3D Optics
3M Projector
4geek
AAXA Technologies
ABox42
AC Ryan
Access HD
Accell
Acco Nobo
Accurian
Ace
Acer
Acesonic
AComDigital
Admiral
Advance
Advueu
AFK
Agath
AGK
AGPtek
Airis
Airlink
Airsat
Airton
Akira
Albis
Alcor
Alfa
Alma
…
Supported Device Types
AV System
Blu Ray
Air Conditioner
CD/DVD/VCR
Home Theatre System
IPod
Media Manager
Projector
Set Top Box
Soundbar
TV
Aux
Receiver/Preamp
Other
Subwoofer
Tuner
Switcher
Supported Brand List
10Moons
3D Optics
3M Projector
4geek
AAXA Technologies
ABox42
AC Ryan
Access HD
Accell
Acco Nobo
Accurian
Ace
Acer
Acesonic
AComDigital
Admiral
Advance
Advueu
AFK
Agath
AGK
AGPtek
Airis
Airlink
Airsat
Airton
Akira
Albis
Alcor
Alfa
Alma
Altech UEC
Altek
Amiko
Amitech
Amstrad
AMTC
A-NeuVideo
AOpen
Apple
Aquario
Aquavision
Arantia
Arcon
Ario
Artec
Arvani
ASDA
Aston
Astone
Astra
Asus
Atec
Atemio
Atevio
Atlanta DTH
ATN
Atto
AudioSonic
Audiovox
Auria
Auvio
Auvisio
AV Tech
Avanit
Avatec
Avera
AVerMedia
AVF
AVOL
Avov
AWA
Axas
Axil
Axion
AZ America
AZbox
AzureWave
Baff
Balmat
Bauer
Bauhn
Baumann Meyer
Bel Digital
Bellagio
Belson
BenQ
Bernelli
BeSat
Best Buy
Bexa
Beyonwiz
BGH
Black Widow
Blade
Blizoo
Blu Sens
Bluetech
Botech
Bouygues Telecom
Box Office
Brennan
Brite-View
Broksonic
Bulsatcom
BWare
Cable One
Cablemas
Cabletech
Cannon
Canton
Captive Works
Carrier
Casio
CAT
CCE
CE Labs
CE-Link
Celera
Cello
Centronics
CGV
Challenger
Changhong
Channel Master
Christie
Citizen
CityCom
Clarke-Tech
Cloud Ibox
Cloud Media
CMX
Cobra
Coby
Cocktail Audio
Comag
Comigo
Compro
Conaxsat
Conceptronic
Conia
ConnectGear
Contex
Coolsat
Coolstream
Copland
Coship
Cosmosat
Cox
Craig
Cristor
Crypto
Curtis International
D Smart
Daenyx
Daewoo
Dali
Dane-Elec
Dantax
Dark
Definitive Technology
Dell
Delsat
Delonghi
Denson
Devolo
DGTec
DI-Way
Diamond
Dick Smith
DigiCrystal
Digiquest
Digital Galaxy
Digital Lifestyles
Digital Projection
Digital Watchdog
Digitalbox
Digitalstream
DigitalView
Digitech
Digitex
Digitron
Digitronic
Digiline
Digimate
Digi-Media
Digimerge
Digitel
Digiview
Digix Media
Dikom
Dilog
DiVinci
Dizipia
DK Digital
DLO
DMX
DNT
Dr. HD
Dragon
Dream Vision
DreamLink
Dreamsky
DSPeaker
Dual
Dune
Duosat Troy
Duosat
Durabrand
Duronic
Dussun
DVI Gear
Dvico
DXtreme
Dynasat
Dynaudio
Dynavox
Dynex
Dyon
E-SDS
Easy Living
Easy Touch
Edifier
Edision
Egreat
Eiki
Electric Mirror
Electrohome
Electrolux
Element
Elgato
Ellion
Elta
Eltax
Eltex
Ematic
Eminent
Emish
Emprex
Emtec
Energy
Engel Axil
Englaon
Enox
Enseo
Entiveo
Envision
Envizen
Episode
Epson
EsoSat
Esoteric
Essential B
Estone
Etekcity
Eurostar
Euston
EverFocus
Evesham
Eviant
Evolution
Evolve
Evolveo
Evotel
Exterity
Extron
Eycos
F&D
Fair Mate
Fantec
Faval
Favi Entertainment
Felston
Ferguson
Fetch TV
Firgelli
Fisher
Fluid
Fonestar
Formuler
Fortec Star
Foscam
Fosgate
Fosmon
FosPower
Fostex
Freecom
Freei
Freesat
Freesky
Frigidaire
FTE Maximal
Fujicom
Fujionkyo
Funai
Furrion
Future Automation
FX Audio
G-Box
Galaxy Innovations
Gateway
Geant Electronics
Geha
General Satellite
Genesis
Geneva Sound
Geneva
Genius
Gericom
Gigablue
GlobalSat
Golden Interstar
Golden Media
Goldmaster
GooBang Doo
GoSat
Gosonic
Gospell
Gradiente
Gran Prix
Grundig
GVA
Haier
Haivision
Hannspree
Hantech
Harman Kardon
Haute
HB Multimedia
HCT
HD-Box
HDT Terrestrial
He@d (Head)
Healing Digital
Hegel
Hicon
Hills
Himedia
Hiremco
Hirschmann
Hitachi
Hiteker
HKC
Homecast
Homeworx
Hot
HTS
Hualu
Humax
Hybroad
Hypex
Hyundai
I Ball
I Com
I Home
I Live
I Net
I O Data
I Set
Icecrypt
iconBIT
IDdigital
Idroidnation
iLink
IncrediSonic
Infinity
InFocus
Infomir
Initial
InLine
iNneXT
Innovative Technology
Insignia
Integra
Invex
IRRadio
Istar
it Magic
IView
Jadoo
Jaeger
James
Jaytech
JBL
Jensen
Jepssen
Jolida
JWin
Jynxbox
Kaiser Baas
Kaon
Kathrein
Kawasaki
KCPI
KDLinks
KEF
Kendo
Kenmore
Kicker
Kinivo
Kinyo
Kirsch
Klipsch
Knoll
Koda
Kodi
Kogan
Kolin
Konig
Konka
Koramzi
Korax
Koscom
Krell
KWorld
Kyocera
LaCie
Laser
LeEco
Leelbox
Lenco
Lennox
Lenovo
Lenoxx
Leon Speakers
LeTV
Level
Lexicon
Lexium
LG
Linksys
Logik
Logic3
Logisat
Logitech
Loranz
Luma
Lumax
Megasat
Neta
Next
Octagon
Olevia
Olin
Onkyo
Openbox
Optex
Philips
Redline
Rotel
Samsung
Samux
Sansui
Sceptre
Siemens
Sunny
TCL
Telefunken
Toshiba
Vestel
XTek
Yamaha
Yumatu
Other
- Car/MP3 Remote controller
Comparable Android apps
The five apps in Tools with the closest revenue to Infrared. Click any to see its detail page.
Each forecast combines App Store rating, ratings count, monetisation model, pricing tier, IAP signals and ad-supported flag.
The base estimate is then multiplied by a per-category scaling factor learned from apps with founder-verified MRR.
Every number on this page comes from public APIs and bumetric's own snapshot history.
Full methodology covers input variables, accuracy bands per category and how we treat apps without comparable anchors.
See also the live data on Infrared's tracker page for current rating, reviews and snapshot timeline.
Building something similar? Get a free AI audit with $-revenue forecasts for every recommendation.


 Itzuli
 Push Notification Assistant
 EPhone: Everything USSD
 Call Bell
 App Manager-copy/backup/send