What Injectable drugs actually does (from store listing)
The prescription or administration of injectable drugs requires taking into account many parameters related to the patient and the disease to be treated. The optimal choice of injection route is not always obvious, especially if the conditions of administration (emergency, particular patient) do not allow time to consult documents and instructions for use which are sometimes very dense. True therapeutic tool, this work makes available to the prescriber or the user of injectable drugs, clear and …
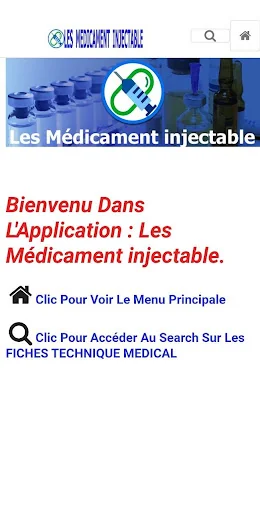
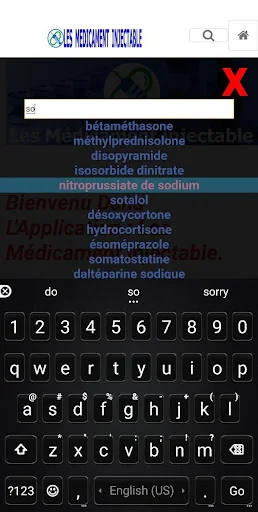
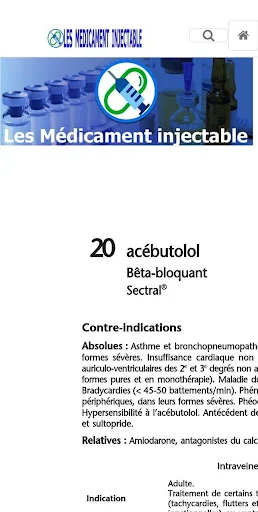
The prescription or administration of injectable drugs requires taking into account many parameters related to the patient and the disease to be treated. The optimal choice of injection route is not always obvious, especially if the conditions of administration (emergency, particular patient) do not allow time to consult documents and instructions for use which are sometimes very dense. True therapeutic tool, this work makes available to the prescriber or the user of injectable drugs, clear and practical information presented in a synthetic way in the form of tables thus allowing a fast and effective use. It specifies for each drug the route of injection and the conditions of administration commonly practiced, as well as the monitoring of the treatment, during and after the injection. Written in the form of files classified by specialties and by DCI, this book recalls the trade names, absolute and relative contraindications, the precautions for use and the storage conditions of each drug. The indications, dosages as well as presentations, dilutions and administration are detailed according to the chosen injection route. For certain drugs used with the electric syringe pump, tables of infusion rates are available. This practical guide to injectable drugs in pocket format is a unique and original tool for all practitioners, interns, medical students, nurses and student nurses. In addition, this book is complemented by an online supplement making available to the reader downloadable sheets of less common but equally important drugs. To access the online supplement to this book
Comparable Android apps
The five apps in Medical with the closest revenue to Injectable drugs. Click any to see its detail page.
Each forecast combines App Store rating, ratings count, monetisation model, pricing tier, IAP signals and ad-supported flag.
The base estimate is then multiplied by a per-category scaling factor learned from apps with founder-verified MRR.
Every number on this page comes from public APIs and bumetric's own snapshot history.
Full methodology covers input variables, accuracy bands per category and how we treat apps without comparable anchors.
See also the live data on Injectable drugs's tracker page for current rating, reviews and snapshot timeline.
Building something similar? Get a free AI audit with $-revenue forecasts for every recommendation.
 prepMIR
 Corrected age
 RCP para padres
 Entr'Actes
 m3 ToDo Plus