Join more than 50.000 success stories and start reducing your pain today. Developed by doctors and scientists, our app is trustworthy, effective, and available when and where you need it.
THE BEST APP FOR TREATING INJURIES ON YOUR OWN
Injurymap’s smart training algorithm will guide you through your treatment by continuously adjusting your exercises to manage your specific pain. There are many advantages of using this pain treatment method: weight loss, better sleep, and a stronger body, all …
Join more than 50.000 success stories and start reducing your pain today. Developed by doctors and scientists, our app is trustworthy, effective, and available when and where you need it.
THE BEST APP FOR TREATING INJURIES ON YOUR OWN
Injurymap’s smart training algorithm will guide you through your treatment by continuously adjusting your exercises to manage your specific pain. There are many advantages of using this pain treatment method: weight loss, better sleep, and a stronger body, all without any side effects.
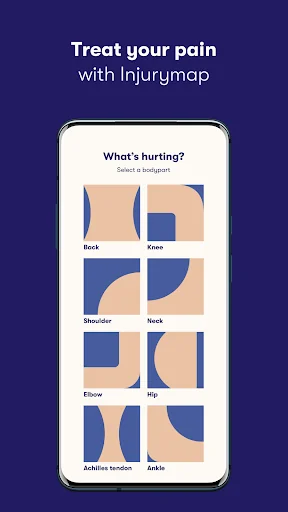
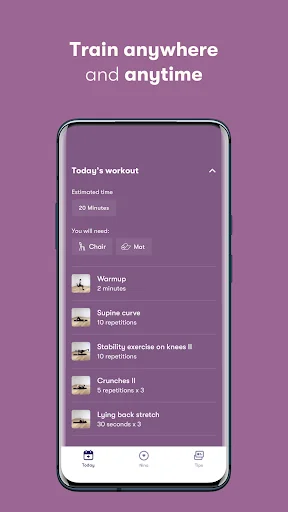
TREAT YOUR PAIN FROM HOME
Your daily workout can be completed right from your living room and covers everything you need in order to get back to your normal activities. Each workout takes your trough exercises that strengthen your muscles and train your range of motion and balance.
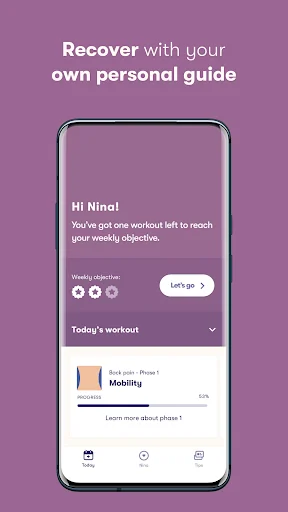
STAY MOTIVATED
Avoid doing the same boring exercises day after day with your daily program that updates your exercises based on your progress. Get friendly reminders that keep you in the right mindset from the get-go and help you stay motivated even when you’re having a tough day,
WHAT YOU’LL GET
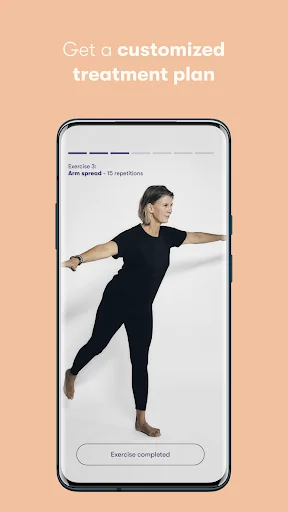
* A personalized treatment program that addresses your pain.
* Access to 350+ unique video exercises performed by physiotherapists.
* 100+ tips that help you deal with your injury, written by doctors.
* Track your treatment plan progress, pain reduction, and number of workouts.
* Reminders to help you remember your exercises (if you want them :-) ).
“Thanks for helping me have painless workdays
I've dealt with neck and shoulder pain and found several great exercises in Injurymap that are easy to do in everyday life and have helped me from day one - thanks for the help!”
- BERTELT
“Really effective
I've been using the app for over a month now, and it has had a really positive effect on my worn-out back.”
- AFHRAEL
“It is really easy to use and has good illustrations of the exercises. The training has helped me become pain-free.”
- PERPEDERSEN
Hear from more users here: https://www.injurymap.com/testimonials
INJURYMAP COVERS THE FOLLOWING AREAS
Achilles pain
Ankle pain
Arch pain
Back pain
Elbow pain
Hip pain
Knee pain
Neck pain
Shoulder pain
Injurymap is CE-marked as a medical device. The CE mark guarantees that Injurymap conforms to the health and safety standards set by the European Union.
SUBSCRIPTION PRICING AND TERMS
Injurymap is free to use for a trial period of two weeks, during which you are free to cancel your subscription at no cost. Injurymap requires a paid subscription after the trial period expires:
12 months: £40.99
1 month: £8.99
• The subscription period is for one month or 12 months and provides full access to all exercises in Injurymap.
• Payment is charged to your Google Play account at confirmation of purchase.
• Please note that subscriptions are automatically renewed unless automatic renewal has been turned off no later than 24 hours before the end of the subscription period.
• Your account will be charged for renewal within 24 hours before the end of the current period.
• You can cancel automatic renewal of your subscription by navigating to the settings menu in your Google Play account.
• Any unused portion of the two-week free trial period is forfeited when a subscription is purchased.
Terms of use: https://www.injurymap.com/terms
Comparable Android apps
The five apps in Health & Fitness with the closest revenue to Injurymap. Click any to see its detail page.
Each forecast combines App Store rating, ratings count, monetisation model, pricing tier, IAP signals and ad-supported flag.
The base estimate is then multiplied by a per-category scaling factor learned from apps with founder-verified MRR.
Every number on this page comes from public APIs and bumetric's own snapshot history.
Full methodology covers input variables, accuracy bands per category and how we treat apps without comparable anchors.
See also the live data on Injurymap's tracker page for current rating, reviews and snapshot timeline.
Building something similar? Get a free AI audit with $-revenue forecasts for every recommendation.
 NHF
NHF
 Сон - помощь при бессоннице, м
 Zwemwater
 Calculadora da Fertilidade
 PM2.5と黄砂の予測 大気汚染予報