What Inside the Box actually does (from store listing)
Test your logic by solving the puzzles from all the boxes.
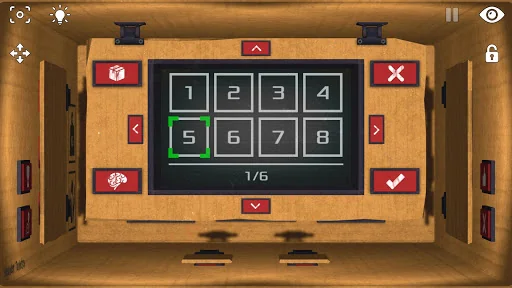
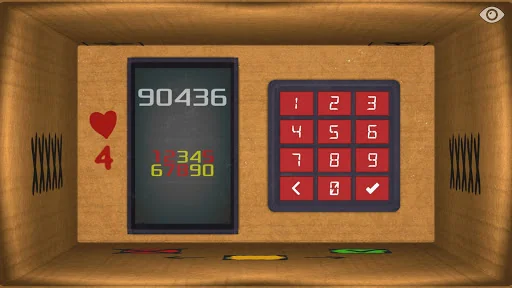
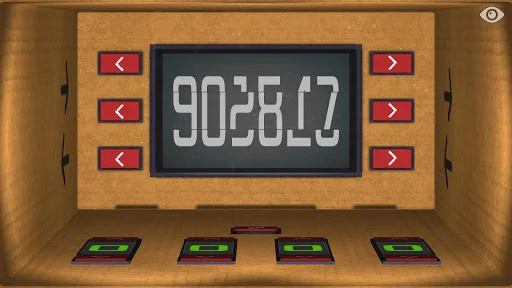
An unlock code is encrypted in each of the boxes, and you can get it if you solve the puzzle.
The tasks inside of all the boxes are absolutely logical, they contain no hidden buttons or doors - they are intended just to test your logical abilities.
Most puzzles will require you to find digits, numbers, code words, as well as solve math problems.
The game includes a system for generating puzzles. This means that every time you complet…
Test your logic by solving the puzzles from all the boxes.
An unlock code is encrypted in each of the boxes, and you can get it if you solve the puzzle.
The tasks inside of all the boxes are absolutely logical, they contain no hidden buttons or doors - they are intended just to test your logical abilities.
Most puzzles will require you to find digits, numbers, code words, as well as solve math problems.
The game includes a system for generating puzzles. This means that every time you complete the game, all tasks and answers to them will be automatically generated and will not be repeated again.
The game offers a gyroscope control feature, which lets you feel like you are really holding a box with puzzles in your hands. There is also an alternative control option for on-screen buttons.
Will you be able to pick all the passwords and combinations hidden inside?
Challenge accepted?!
Comparable Android apps
The five apps in Puzzle with the closest revenue to Inside the Box. Click any to see its detail page.
Each forecast combines App Store rating, ratings count, monetisation model, pricing tier, IAP signals and ad-supported flag.
The base estimate is then multiplied by a per-category scaling factor learned from apps with founder-verified MRR.
Every number on this page comes from public APIs and bumetric's own snapshot history.
Full methodology covers input variables, accuracy bands per category and how we treat apps without comparable anchors.
See also the live data on Inside the Box's tracker page for current rating, reviews and snapshot timeline.
Building something similar? Get a free AI audit with $-revenue forecasts for every recommendation.

 Link the Puzzles
 2048
2048
 Brain Physics
 Kings Kollege: Fillz
 Nurikabe