What Interlocked actually does (from store listing)
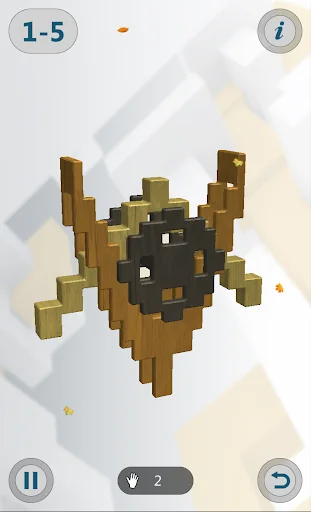
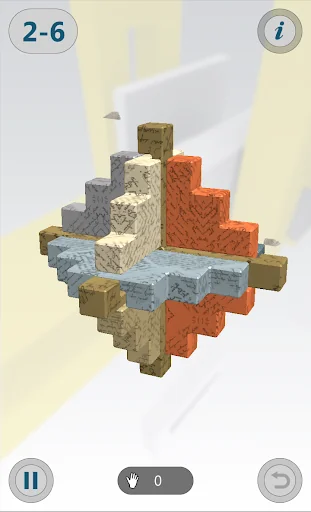
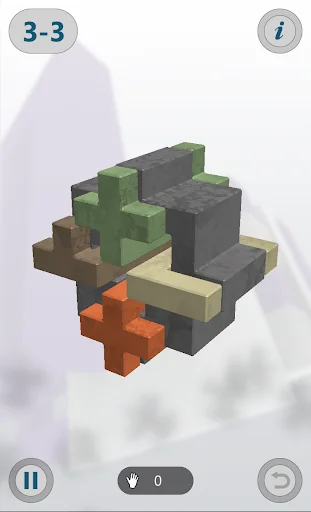
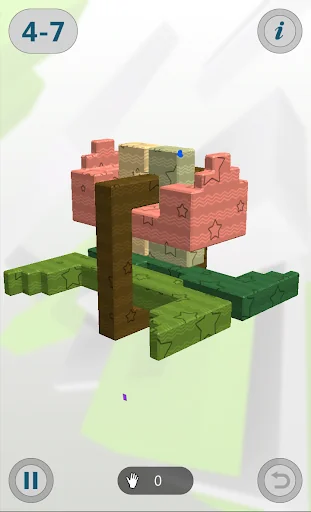
Have you ever seen those masterfully crafted wooden block puzzles? The ones that look so simple, yet prove such a challenge to pull apart? Interlocked serves up cleverly crafted 3D puzzles where the goal is to figure out how each interlocking level fits together in order to pull it apart.
With simple, intuitive, touch-based gameplay and five beautifully crafted chapters, Interlocked will delight puzzles fans of all skill levels, completely free.
- 3D brain-teasing puzzles
- 5 challenging…
Have you ever seen those masterfully crafted wooden block puzzles? The ones that look so simple, yet prove such a challenge to pull apart? Interlocked serves up cleverly crafted 3D puzzles where the goal is to figure out how each interlocking level fits together in order to pull it apart.
With simple, intuitive, touch-based gameplay and five beautifully crafted chapters, Interlocked will delight puzzles fans of all skill levels, completely free.
- 3D brain-teasing puzzles
- 5 challenging chapters to beat
- Brought to you by the creators of the original Flash game, played by over 20 million!
- Many achievements to unlock
Comparable Android apps
The five apps in Puzzle with the closest revenue to Interlocked. Click any to see its detail page.
Each forecast combines App Store rating, ratings count, monetisation model, pricing tier, IAP signals and ad-supported flag.
The base estimate is then multiplied by a per-category scaling factor learned from apps with founder-verified MRR.
Every number on this page comes from public APIs and bumetric's own snapshot history.
Full methodology covers input variables, accuracy bands per category and how we treat apps without comparable anchors.
See also the live data on Interlocked's tracker page for current rating, reviews and snapshot timeline.
Building something similar? Get a free AI audit with $-revenue forecasts for every recommendation.

 Cut It: Brain Puzzles
 Orbit - Playing with Gravity
 Mystery Match - Puzzle Match 3
 Lazors
 A Foreign Land of Us