Interpack App
Description
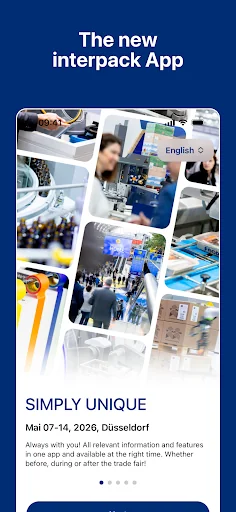
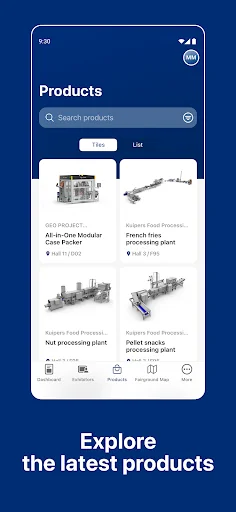
The interpack app helps you plan your visit to the fair, providing comprehensive information on the Packaging machines and appliances, Packaging materials, packaging means and packaging aids at the world No. 1 event in Düsseldorf. The perfect Smartphone integration thanks to offline search, Maps connection and an interactive map of the exhibition centre allow you to prepare your visit to the fair perfectly.
Interactive Site Map and Hall Layout
Optimised site and…
Interpack App
Description
The interpack app helps you plan your visit to the fair, providing comprehensive information on the Packaging machines and appliances, Packaging materials, packaging means and packaging aids at the world No. 1 event in Düsseldorf. The perfect Smartphone integration thanks to offline search, Maps connection and an interactive map of the exhibition centre allow you to prepare your visit to the fair perfectly.
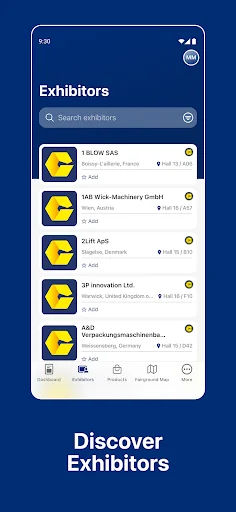
Interactive Site Map and Hall Layout
Optimised site and hall maps provide perfect guidance around the fair grounds. The site offers infinitely variable zoom and all information submitted by exhibitors. Zoom into the individual halls and see all stands. Just click on a stand and all exhibitor information plus the products offered will be displayed.
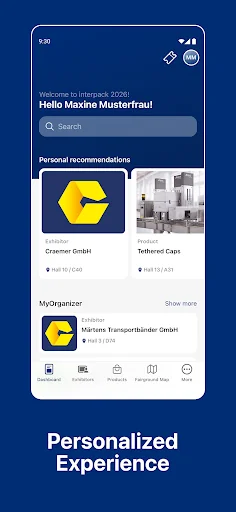
Favourites
Mark specific exhibitors and products as favorites and build your own personal list of things to remember, making the interpack app into your digital companion as you make your way around the fair. Sync your favorites also with your saved portal settings. All needed information will be transferred from your desktop pc to your Smartphone.
News
With the interpack app you are always up to date. Find out about everything to do with the fair and its exhibitors as well as about the latest developments in the glass industry. Exclusive news on our business news channel keeps you up to date all the time – before, during and after the fair.
Information on the trade fair
All details revolving around your visit to the trade fair are presented in this area in a coherent format. Information on opening hours, admission prices, focal ranges on display, to name but a few assist you in optimally preparing your visit to the trade fair. Thanks to the comprehensive integration of calender and Maps your Smartphone will become a perfect companion guide at the fair.
Trade Fairs in Düsseldorf
Hosting 50 trade fairs at its Düsseldorf Exhibition Centre, of which 24 are global premium trade fairs in their sectors, and about 120 of its own events the Messe Düsseldorf Group is among the leading export platforms worldwide. Gain an overview of all trade fairs held at the Düsseldorf Exhibition Centre including key data on the individual events.
interpack 2017 – International Trade Fair for Packaging machines and appliances, Packaging materials, packaging means, packaging aids.
www.interpack.com
* the offline search covers selected contents of the database.
Comparable Android apps
The five apps in Business with the closest revenue to interpack. Click any to see its detail page.
Each forecast combines App Store rating, ratings count, monetisation model, pricing tier, IAP signals and ad-supported flag.
The base estimate is then multiplied by a per-category scaling factor learned from apps with founder-verified MRR.
Every number on this page comes from public APIs and bumetric's own snapshot history.
Full methodology covers input variables, accuracy bands per category and how we treat apps without comparable anchors.
See also the live data on interpack's tracker page for current rating, reviews and snapshot timeline.
Building something similar? Get a free AI audit with $-revenue forecasts for every recommendation.

 FNV Bouw
 Philips Field Apps
 KOEL iGreen
 KingTasker
 CEC Connect