What Introductory Statistics Book actually does (from store listing)
Introductory Statistics TextBook by OpenStax plus MCQ, Essay Questions & Key Terms
Introductory Statistics follows scope and sequence requirements of a one-semester introduction to statistics course and is geared toward students majoring in fields other than math or engineering. The text assumes some knowledge of intermediate algebra and focuses on statistics application over theory. Introductory Statistics includes innovative practical applications that make the text relevant and accessibl…
Introductory Statistics TextBook by OpenStax plus MCQ, Essay Questions & Key Terms
Introductory Statistics follows scope and sequence requirements of a one-semester introduction to statistics course and is geared toward students majoring in fields other than math or engineering. The text assumes some knowledge of intermediate algebra and focuses on statistics application over theory. Introductory Statistics includes innovative practical applications that make the text relevant and accessible, as well as collaborative exercises, technology integration problems, and statistics labs.
1.1. Definitions of Statistics, Probability, and Key Terms
1.2. Data, Sampling, and Variation in Data and Sampling
1.3. Frequency, Frequency Tables, and Levels of Measurement
1.4. Experimental Design and Ethics
1.5. Data Collection Experiment
1.6. Sampling Experiment
2. Descriptive Statistics
2.1. Stem-and-Leaf Graphs (Stemplots), Line Graphs, and Bar Graphs
2.2. Histograms, Frequency Polygons, and Time Series Graphs
2.3. Measures of the Location of the Data
2.4. Box Plots
2.5. Measures of the Center of the Data
2.6. Skewness and the Mean, Median, and Mode
2.7. Measures of the Spread of the Data
2.8. Descriptive Statistics
3. Probability Topics
3.2. Independent and Mutually Exclusive Events
3.3. Two Basic Rules of Probability
3.4. Contingency Tables
3.5. Tree and Venn Diagrams
3.6. Probability Topics
4. Discrete Random Variables
4.1. Probability Distribution Function (PDF) for a Discrete Random Variable
4.2. Mean or Expected Value and Standard Deviation
4.3. Binomial Distribution
4.4. Geometric Distribution
4.5. Hypergeometric Distribution
4.6. Poisson Distribution
4.7. Discrete Distribution (Playing Card Experiment)
4.8. Discrete Distribution (Lucky Dice Experiment)
5. Continuous Random Variables
5.1. Continuous Probability Functions
5.2. The Uniform Distribution
5.3. The Exponential Distribution
5.4. Continuous Distribution
6. The Normal Distribution
6.1. The Standard Normal Distribution
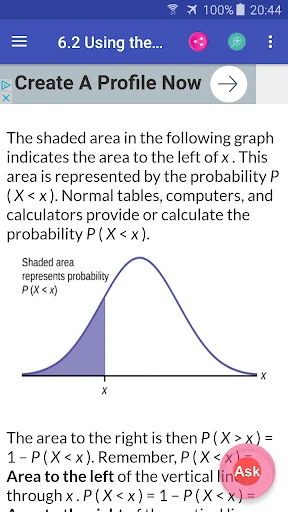
6.2. Using the Normal Distribution
6.3. Normal Distribution (Lap Times)
6.4. Normal Distribution (Pinkie Length)
7. The Central Limit Theorem
7.1. The Central Limit Theorem for Sample Means (Averages)
7.2. The Central Limit Theorem for Sums
7.3. Using the Central Limit Theorem
8. Confidence Intervals
8.1. A Single Population Mean using the Normal Distribution
8.2. A Single Population Mean using the Student t Distribution
8.3. A Population Proportion
9. Hypothesis Testing with One Sample
9.1. Null and Alternative Hypotheses
9.2. Outcomes and the Type I and Type II Errors
9.3. Distribution Needed for Hypothesis Testing
9.4. Rare Events, the Sample, Decision and Conclusion
9.5. Additional Information and Full Hypothesis Test Examples
9.6. Hypothesis Testing of a Single Mean and Single Proportion
10. Hypothesis Testing with Two Samples
10.1. Two Population Means with Unknown Standard Deviations
10.2. Two Population Means with Known Standard Deviations
10.3. Comparing Two Independent Population Proportions
10.4. Matched or Paired Samples
10.5. Hypothesis Testing for Two Means and Two Proportions
11. The Chi-Square Distribution
11.2. Goodness-of-Fit Test
11.3. Test of Independence
11.4. Test for Homogeneity
11.6. Test of a Single Variance
12. Linear Regression and Correlation
12.1. Linear Equations
12.2. Scatter Plots
12.3. The Regression Equation
12.4. Testing the Significance of the Correlation Coefficient
12.5. Prediction
12.6. Outliers
12.7. Regression (Distance from School)
12.8. Regression (Textbook Cost)
12.9. Regression (Fuel Efficiency)
13. F Distribution and One-Way ANOVA
Comparable Android apps
The five apps in Education with the closest revenue to Introductory Statistics Book. Click any to see its detail page.
Each forecast combines App Store rating, ratings count, monetisation model, pricing tier, IAP signals and ad-supported flag.
The base estimate is then multiplied by a per-category scaling factor learned from apps with founder-verified MRR.
Every number on this page comes from public APIs and bumetric's own snapshot history.
Full methodology covers input variables, accuracy bands per category and how we treat apps without comparable anchors.
See also the live data on Introductory Statistics Book's tracker page for current rating, reviews and snapshot timeline.
Building something similar? Get a free AI audit with $-revenue forecasts for every recommendation.
 Английский Язык ЕГЭ 2026
 Dutch 90.000 words & pictures
 Theology Course
 Learn Telugu From Kannada
 P House – Pic & Sound