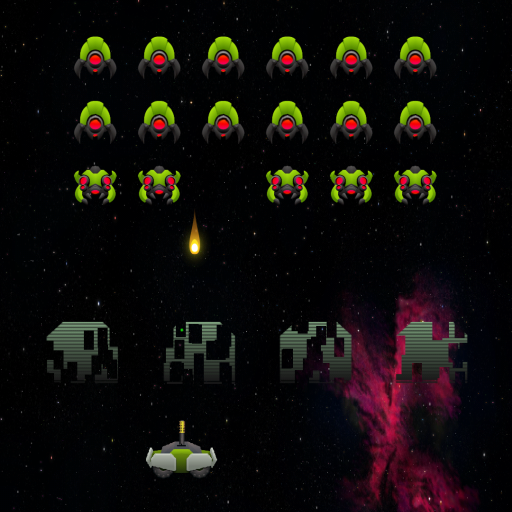
What Invaders Deluxe actually does (from store listing)
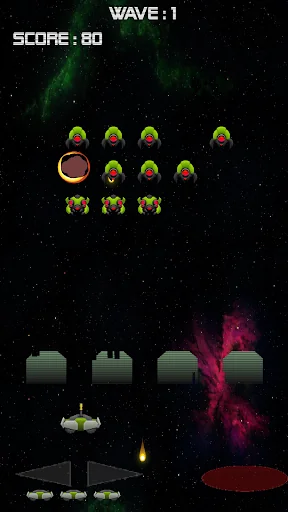
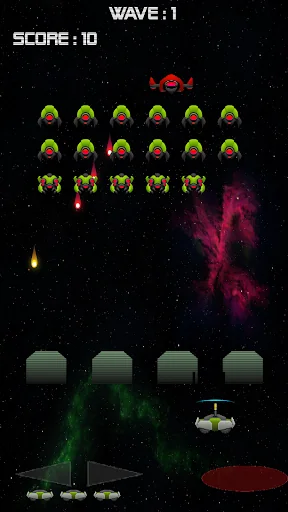
The Invaders are coming! Defend the Earth from a never ending invasion of space aliens and flying saucers!
Full HD 1080p 60 frames per second graphics
Awesome music during gameplay
Extra weapons! Double shot and triple spread shot
Rapid Fire Mode
Shield bonus
Totally Free
Smooth scrolling beautiful backdrop
Collect weapon power-ups to increase your fire power. A game inspired by old school classic arcade shooting games
A great retro shoot'em up (or SHUMP if you prefer) that …
The Invaders are coming! Defend the Earth from a never ending invasion of space aliens and flying saucers!
Full HD 1080p 60 frames per second graphics
Awesome music during gameplay
Extra weapons! Double shot and triple spread shot
Rapid Fire Mode
Shield bonus
Totally Free
Smooth scrolling beautiful backdrop
Collect weapon power-ups to increase your fire power. A game inspired by old school classic arcade shooting games
A great retro shoot'em up (or SHUMP if you prefer) that stands the test of time
Battle your way through never ending levels that just keep getting harder and faster
A fast paced modern update on the classic 1978 arcade shooter
Normal and Hard Game modes selectable
Top ten high score tables for both game modes
Bluetooth Gamepad support
3 on screen control modes selectable
Share your best score and highest level on our Facebook fan page!
Each space invader kill counts to get the highest score you can,
Comparable Android apps
The five apps in Arcade with the closest revenue to Invaders Deluxe. Click any to see its detail page.
Each forecast combines App Store rating, ratings count, monetisation model, pricing tier, IAP signals and ad-supported flag.
The base estimate is then multiplied by a per-category scaling factor learned from apps with founder-verified MRR.
Every number on this page comes from public APIs and bumetric's own snapshot history.
Full methodology covers input variables, accuracy bands per category and how we treat apps without comparable anchors.
See also the live data on Invaders Deluxe's tracker page for current rating, reviews and snapshot timeline.
Building something similar? Get a free AI audit with $-revenue forecasts for every recommendation.

 Burger Jump Journey
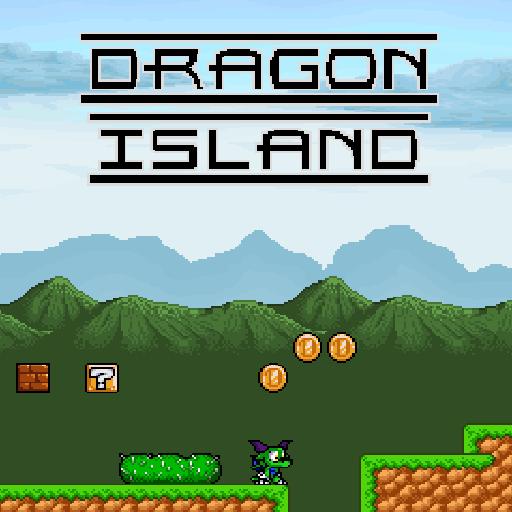 Dragon Island
 Warspace: Galaxy Shooter
 Infinity Sky Racing 3D
 Tower Climbing