What Io Kids: Io Games actually does (from store listing)
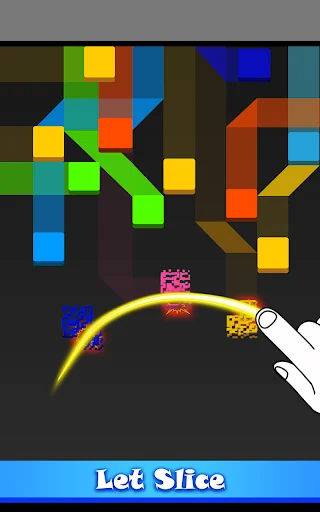
Looking for an arcade game? Want to find out how fast your child is in slicing? Discover Io Kids, a game that helps children slice through waves of slithering paper squares in classic modes.
How to Play:
- Control an agile io ninja to increase your score by slicing boxes and defeating bosses.
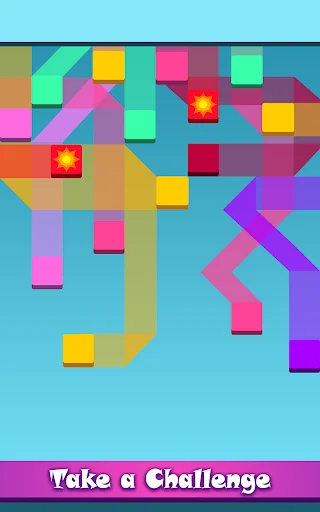
- Avoid red snake boxes to prevent life loss.
Features:
- Access power-ups like slow motion or increased enemies for extended survival.
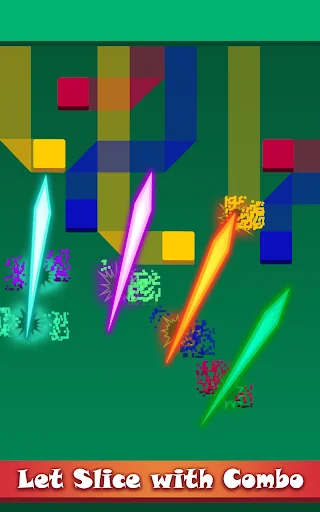
- Explore various elements such as swords, shields, and bomb…
Looking for an arcade game? Want to find out how fast your child is in slicing? Discover Io Kids, a game that helps children slice through waves of slithering paper squares in classic modes.
How to Play:
- Control an agile io ninja to increase your score by slicing boxes and defeating bosses.
- Avoid red snake boxes to prevent life loss.
Features:
- Access power-ups like slow motion or increased enemies for extended survival.
- Explore various elements such as swords, shields, and bombs.
- Utilize combos with special abilities like Double Score and Freeze.
- Experience easy-to-learn controls with challenging mastery.
Target Audience:
- Designed for preschoolers, kindergarteners, toddlers, and older kids who enjoy challenges.
- Parents interested in engaging cutting and chopping entertainment.
Io Kids is a ninja game tailored for your children's enjoyment.
Download Io Kids today and have fun!
Comparable Android apps
The five apps in Casual with the closest revenue to Io Kids: Io Games. Click any to see its detail page.
Each forecast combines App Store rating, ratings count, monetisation model, pricing tier, IAP signals and ad-supported flag.
The base estimate is then multiplied by a per-category scaling factor learned from apps with founder-verified MRR.
Every number on this page comes from public APIs and bumetric's own snapshot history.
Full methodology covers input variables, accuracy bands per category and how we treat apps without comparable anchors.
See also the live data on Io Kids: Io Games's tracker page for current rating, reviews and snapshot timeline.
Building something similar? Get a free AI audit with $-revenue forecasts for every recommendation.
 Yellow Fins
 Super Lee Attack!
 Video_Copter
 VR Temple
 VIP Sniper