What Jump Chaos actually does (from store listing)
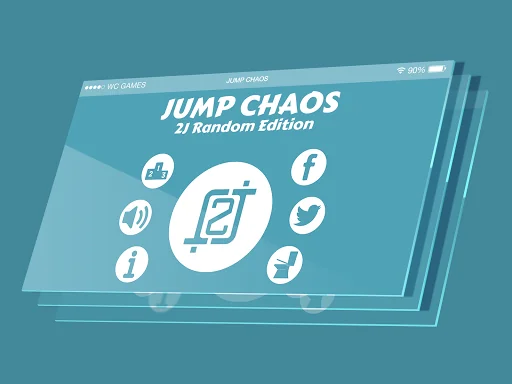
Welcome to "Jump Chaos: 2J Random Edition".
The "Jump Chaos: 2J Random Edition" is a new, free and addictive game for someone who is patient and wants to climbup on the LeaderBoard.
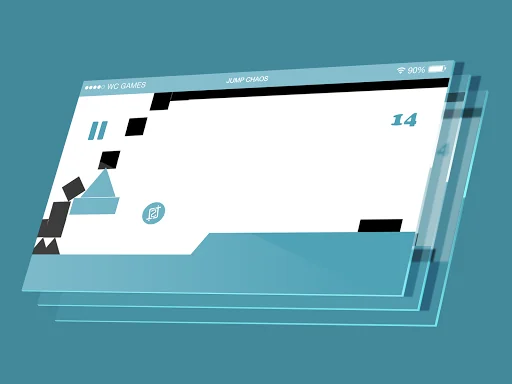
How to play:
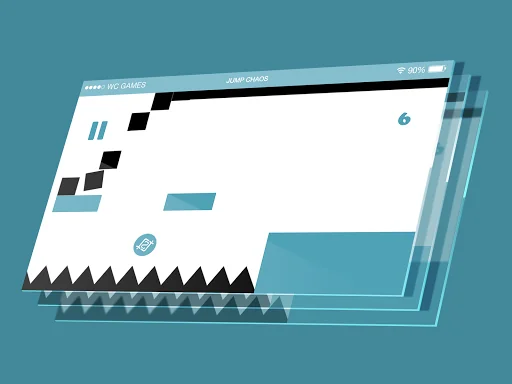
Playing Jump Chaos is simple. Touch anywhere on the screen to jump the 2J Ball. Avoid the black shapes or your character will explode and the game will be over!
Includes:
- Dozens of random levels that change in every new game.
- Logo Icon & Music by 2J, George Ioannou (the best YouTuber i…
The "Jump Chaos: 2J Random Edition" is a new, free and addictive game for someone who is patient and wants to climbup on the LeaderBoard.
How to play:
Playing Jump Chaos is simple. Touch anywhere on the screen to jump the 2J Ball. Avoid the black shapes or your character will explode and the game will be over!
Includes:
- Dozens of random levels that change in every new game.
- Logo Icon & Music by 2J, George Ioannou (the best YouTuber in Cyprus & Greece)
- Free download (with in app purchase for removing ads).
Special Thanks to 2J (George Ioannou):
https://www.youtube.com/user/firekreve2j
https://www.youtube.com/user/2jGaming001
Powered by:
WC Games
http://wc-games.com
Developed by:
Automon
http://automon.gr
Graphics by:
MadPixel
http://madpixel.gr
Music by:
2J (George Ioannou)
https://www.facebook.com/GeorgeIoannou2J
Comparable Android apps
The five apps in Arcade with the closest revenue to Jump Chaos. Click any to see its detail page.
Each forecast combines App Store rating, ratings count, monetisation model, pricing tier, IAP signals and ad-supported flag.
The base estimate is then multiplied by a per-category scaling factor learned from apps with founder-verified MRR.
Every number on this page comes from public APIs and bumetric's own snapshot history.
Full methodology covers input variables, accuracy bands per category and how we treat apps without comparable anchors.
See also the live data on Jump Chaos's tracker page for current rating, reviews and snapshot timeline.
Building something similar? Get a free AI audit with $-revenue forecasts for every recommendation.


 SFCave
 Catch the Candy: Holiday Time
 Slime vs. Mushroom
 Evil Doll - The Horror Game
 Submarine Master for TikTok