What Jump de Coins actually does (from store listing)
Large hole in the bottom of the coin was sleeping ... again!
Appeared as early as the sequel of "Falling de coins" coin exhilarating action! !
The man arrived to dive to the bottom of the hole along with the legendary umbrella of one large hole.
A large amount of coins had been buried there are far When I looked,
It was a dangerous place fell into the lava flowing down and wander from scaffold is bad.
Would activate the ancient device to repel intruders on impact of landing Moreover,…
Large hole in the bottom of the coin was sleeping ... again!
Appeared as early as the sequel of "Falling de coins" coin exhilarating action! !
The man arrived to dive to the bottom of the hole along with the legendary umbrella of one large hole.
A large amount of coins had been buried there are far When I looked,
It was a dangerous place fell into the lava flowing down and wander from scaffold is bad.
Would activate the ancient device to repel intruders on impact of landing Moreover,
Among the pinch from behind the walls of the desperate situation with a large needle is looming
The journey was to prepare oneself for the man, to get the coins ... again.
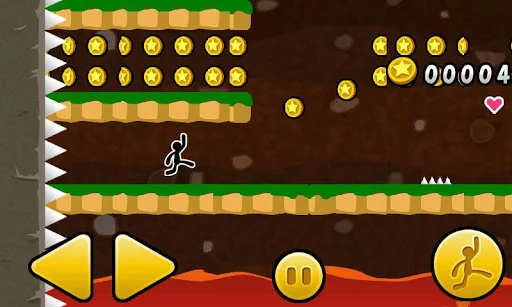
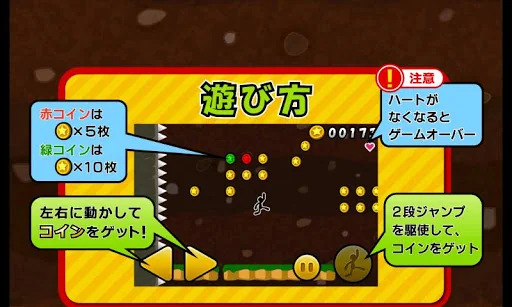
[How to play]
Let's take a coin to operate the hero of the left and right buttons and a jump button!
I'm gonna do it game over fall in lava below, there are no physical touching the needle.
Let's go over any terrain with poor footing by making full use of two-stage jump!
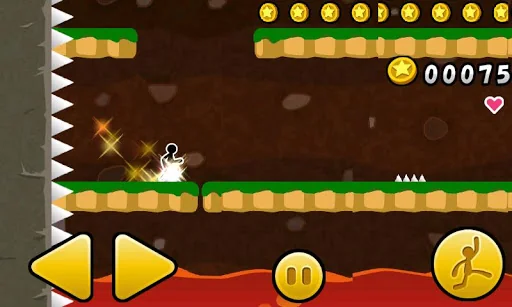
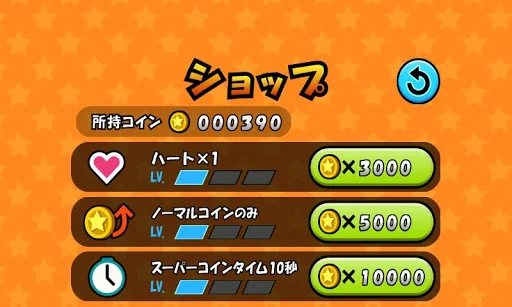
[About the Coin Shop]
You'll collect coins and buy a coin shop!
Or make up your strength, and makes it easier to collect coins or further
Earn coins because more and more useful items they sell!
Take a magic coin shining, I'm rushing to the super coin time! !
Comparable Android apps
The five apps in Arcade with the closest revenue to Jump de Coins. Click any to see its detail page.
Each forecast combines App Store rating, ratings count, monetisation model, pricing tier, IAP signals and ad-supported flag.
The base estimate is then multiplied by a per-category scaling factor learned from apps with founder-verified MRR.
Every number on this page comes from public APIs and bumetric's own snapshot history.
Full methodology covers input variables, accuracy bands per category and how we treat apps without comparable anchors.
See also the live data on Jump de Coins's tracker page for current rating, reviews and snapshot timeline.
Building something similar? Get a free AI audit with $-revenue forecasts for every recommendation.
 Neko Sushi - Stack Game
 Teddy Freddy: Scary Games
 Apple Shooter - Archery Games
 WAR OF TANKS 2016
 Fruit Cut