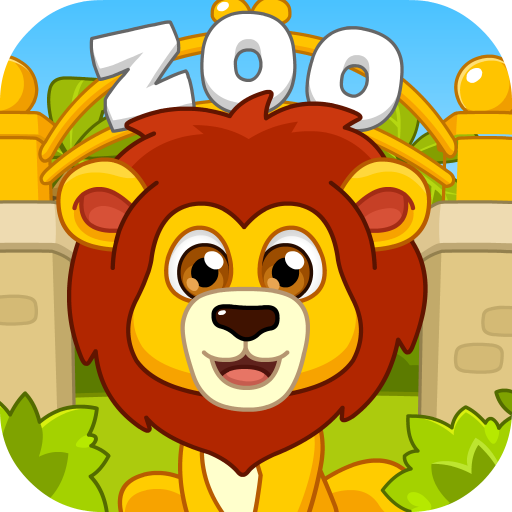
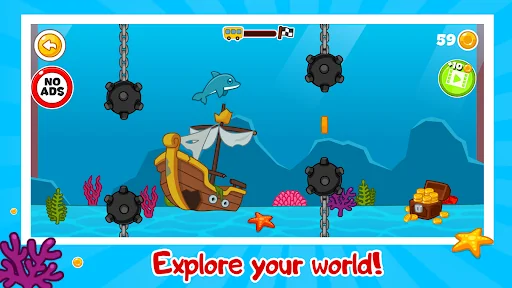
We invite you and your kids to visit our amazing miracle zoo! Meet our new game from the series of developing games for children - "Zoo".
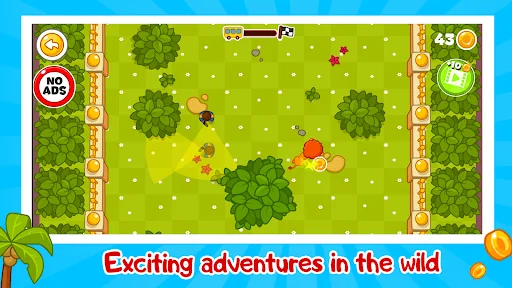
This exciting game will take your kids to the wildlife world, help them become part of the most amazing and fun adventures in the zoo. Do not know how to get to the zoo? Get on our wonderful bus, and he will take you to your destination.
Before entering, do not forget to take tickets to the zoo and start your amazing journey. After all, here you are waited a…
We invite you and your kids to visit our amazing miracle zoo! Meet our new game from the series of developing games for children - "Zoo".
This exciting game will take your kids to the wildlife world, help them become part of the most amazing and fun adventures in the zoo. Do not know how to get to the zoo? Get on our wonderful bus, and he will take you to your destination.
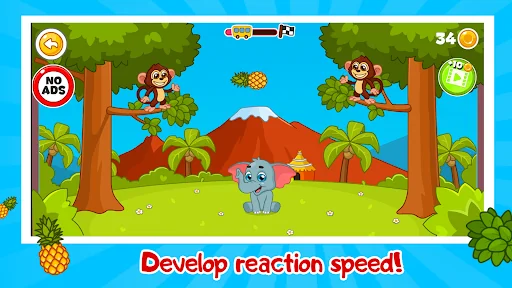
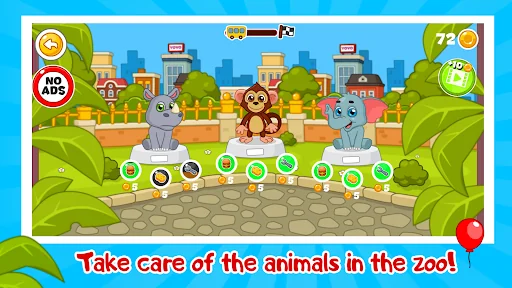
Before entering, do not forget to take tickets to the zoo and start your amazing journey. After all, here you are waited and the lion - the real king of the jungle, and the bear - the owner of the forest, and amusing fidgets of the monkey, and also many other exotic animals. And they all want to play with you in fun and interesting games, wait until you feed them and take care of them. Enjoy the sight and mischief of cute and funny animals, playing our new game zoo for children.
Games about the zoo are ideal cognitive games for children, because they help your child learn - what animals are like, what they look like and what sounds they publish, help to better know the world around them and the living nature. Also in the process of the game develops small motor skills of the hands, visual perception improves, memory develops. But this is very important for the early and all-round development of the child.
Visit us at: Site: https://yovogroup.com/
Comparable Android apps
The five apps in Casual with the closest revenue to Kids Zoo. Click any to see its detail page.
Each forecast combines App Store rating, ratings count, monetisation model, pricing tier, IAP signals and ad-supported flag.
The base estimate is then multiplied by a per-category scaling factor learned from apps with founder-verified MRR.
Every number on this page comes from public APIs and bumetric's own snapshot history.
Full methodology covers input variables, accuracy bands per category and how we treat apps without comparable anchors.
See also the live data on Kids Zoo's tracker page for current rating, reviews and snapshot timeline.
Building something similar? Get a free AI audit with $-revenue forecasts for every recommendation.
 Billiard Games
 Truth Or Dare-Fun With Friends
 Home Cleanup - House Cleaning
 Epic Dragon Evolution - Merge
 Dream Fashion Shop 3