What Kinetic Secure Plus actually does (from store listing)
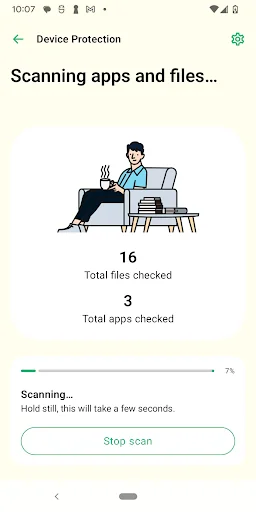
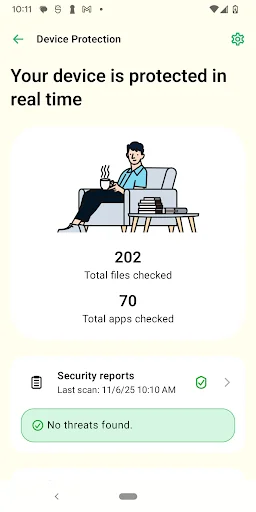
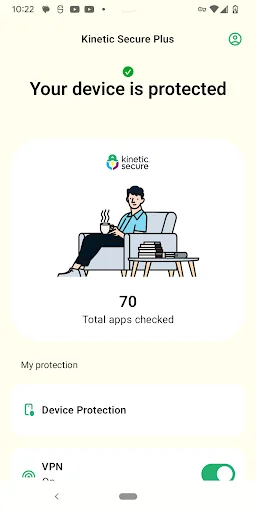
Kinetic Secure Plus is an all-in-one application that provides complete security, privacy, and identity monitoring for consumers, unifying core protections--parental controls, safe browsing, anti-virus scans--with advanced layers including VPN internet encryption, scam protection, Wi-Fi protection, ad blocker and cookie pop-up blocker. Kinetic Secure Plus helps customers internet better by simplifying security while adding depth against today's complex threats and scams.
SEPARATE ‘SAFE BROWS…
Kinetic Secure Plus is an all-in-one application that provides complete security, privacy, and identity monitoring for consumers, unifying core protections--parental controls, safe browsing, anti-virus scans--with advanced layers including VPN internet encryption, scam protection, Wi-Fi protection, ad blocker and cookie pop-up blocker. Kinetic Secure Plus helps customers internet better by simplifying security while adding depth against today's complex threats and scams.
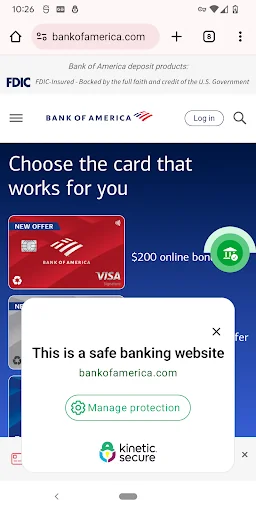
SEPARATE ‘SAFE BROWSER’ ICON IN LAUNCHER
Safe browsing works only when you are browsing the Internet with Safe Browser. To easily allow you to set Safe Browser as default browser, we install this as an additional icon in the launcher.
DATA PRIVACY COMPLIANCE
Windstream always applies strict security measures to protect the confidentiality and integrity of your personal data. See the full privacy policy here: windstream.com/about/legal/privacy-policy
THIS APP USES THE DEVICE ADMINISTRATOR PERMISSION
Device Administrator rights are required for the application to perform and Windstream is using the respective permissions in full accordance to Google Play policies and with active consent by the end-user.
THIS APP USES ACCESSIBILITY SERVICES
This app uses Accessibility services. Windstream is using the respective permissions with active consent by the end-user. The Accessibility permissions are used for Family Rules feature, in particular:
• Allowing a parent to protect child from unsuitable web content.
• Allowing a parent to apply device and apps usage restrictions for a child. With the Accessibility Service, applications usage can be monitored and restricted.
Comparable Android apps
The five apps in Business with the closest revenue to Kinetic Secure Plus. Click any to see its detail page.
Each forecast combines App Store rating, ratings count, monetisation model, pricing tier, IAP signals and ad-supported flag.
The base estimate is then multiplied by a per-category scaling factor learned from apps with founder-verified MRR.
Every number on this page comes from public APIs and bumetric's own snapshot history.
Full methodology covers input variables, accuracy bands per category and how we treat apps without comparable anchors.
See also the live data on Kinetic Secure Plus's tracker page for current rating, reviews and snapshot timeline.
Building something similar? Get a free AI audit with $-revenue forecasts for every recommendation.

 Walton AC
 GIGGO Partner
 CudaLaunch
 FieldCo.
 Gazpacho Mobile