Let Kinsa guide you from the first sign of sickness through recovery and beyond! As seen in Apple’s “Parenthood” commercial, Parents Magazine, USA Today, Good Morning America, The New York Times, CBS This Morning, and more!
KNOW WHAT TO DO NEXT
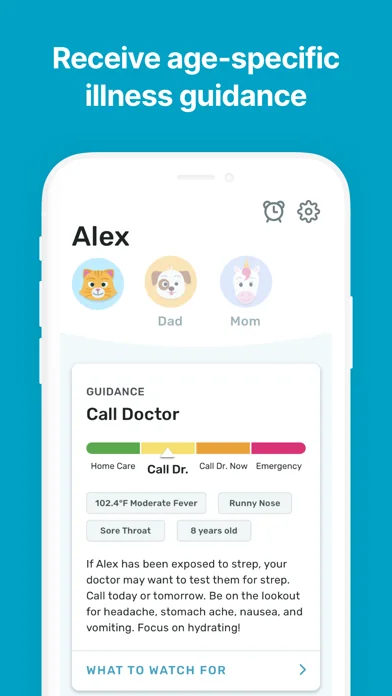
Our care recommendations give you peace of mind with age-specific fever and symptom guidance - so you can know when it’s important to take extra precaution or see a doctor.
REMEMBERS FOR YOU
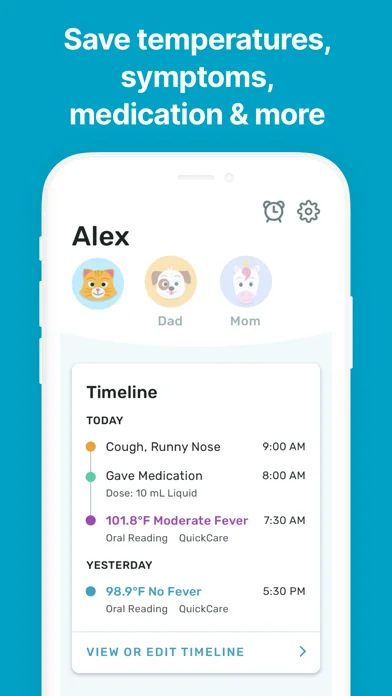
Easily track temperatures, symptoms and medication for everyon…
Let Kinsa guide you from the first sign of sickness through recovery and beyond! As seen in Apple’s “Parenthood” commercial, Parents Magazine, USA Today, Good Morning America, The New York Times, CBS This Morning, and more!
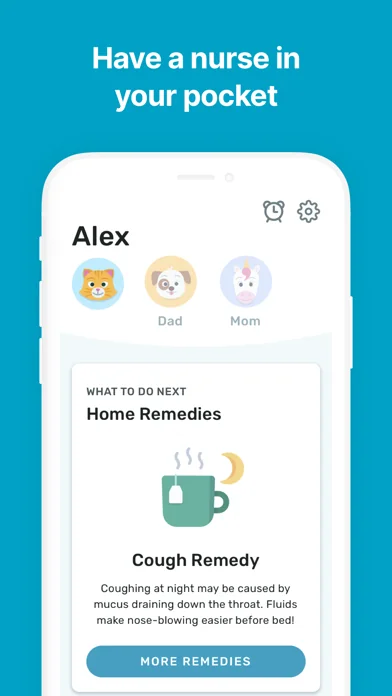
KNOW WHAT TO DO NEXT Our care recommendations give you peace of mind with age-specific fever and symptom guidance - so you can know when it’s important to take extra precaution or see a doctor.
REMEMBERS FOR YOU Easily track temperatures, symptoms and medication for everyone in your family! Remember details such as when symptoms began, how high the fever got, or when to give another dose of medication and share it with another caregiver or your doctor. Temperature data integrates seamlessly with HealthKit and the Health app.
WHAT PARENTS ARE SAYING “The app tracks and organizes our family’s temps and symptoms and keeps the history. This is a wonderful app for a busy and sleep deprived mom!” “Hands down my favorite feature is that the app gives you suggestions on how to keep your little one comfortable and gives practical advice for a speedy recovery!” “The Kinsa app keeps all my data in one place and makes doctors appointments a breeze…” “We are a family of 6! Kinsa helps us keep track of everyone’s medical situation!” “This has to be one of the best products on the market for families, especially families with little ones!”
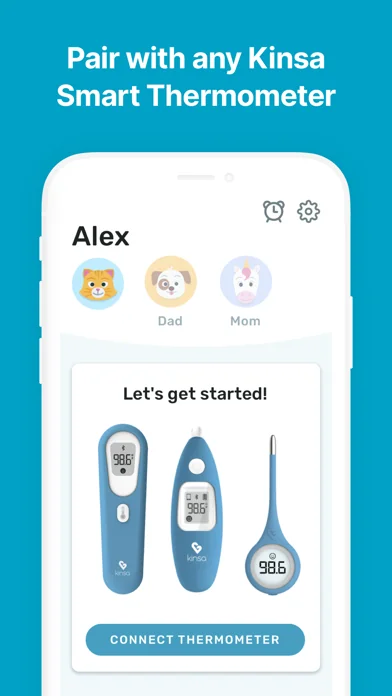
The free Kinsa app works best with Kinsa's award-winning, pediatrician-recommended QuickCare, QuickScan, and Smart Ear thermometers, available for purchase online and in retail stores across the U.S. If you have an older Smart Stick thermometer that plugs into the headphone jack of your phone, please use the Kinsa Smart Stick app instead.
We hope your family doesn't get sick, but if they do, we'll be there to help your family feel better faster!
All information, images, and other content shared through Kinsa’s mobile or web applications is for informational purposes only and is not intended to be a substitute for professional medical advice, diagnosis or treatment from an appropriately qualified and licensed physician or other healthcare provider. Always seek the advice of a qualified healthcare provider with any questions you may have regarding your health, including any symptoms that are severe or concerning. If you are having a medical emergency, call 911 or the number for the local emergency ambulance service. Never disregard professional medical advice or delay seeking medical treatment because of something you have read on or accessed through this application.
Full medical disclaimer here: https://www.kinsahealth.co/research/medical-information-from-kinsa/
Comparable iOS apps
The five apps in Medical with the closest revenue to Kinsa. Click any to see its detail page.
Each forecast combines App Store rating, ratings count, monetisation model, pricing tier, IAP signals and ad-supported flag.
The base estimate is then multiplied by a per-category scaling factor learned from apps with founder-verified MRR.
Every number on this page comes from public APIs and bumetric's own snapshot history.
Full methodology covers input variables, accuracy bands per category and how we treat apps without comparable anchors.
See also the live data on Kinsa's tracker page for current rating, reviews and snapshot timeline.
Building something similar? Get a free AI audit with $-revenue forecasts for every recommendation.


 Grifols Plasma Donor Hub
 Contraction Timer & Tracker
 Oticon Companion
 Cedars-Sinai
 CVS Caremark