What L&N FCU Mobile actually does (from store listing)
The L&N Mobile App makes it easy for you to bank on the go - right from your phone or tablet!
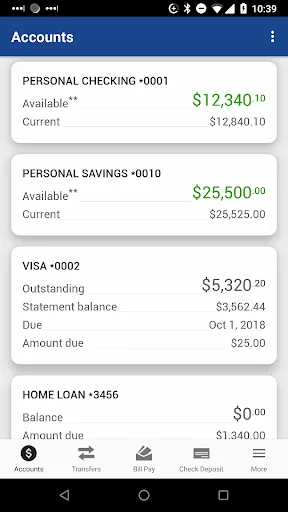
It’s fast, secure, FREE, and gives you more control of your finances. With L&N FCU Mobile, you can:
• Check balances & transaction history
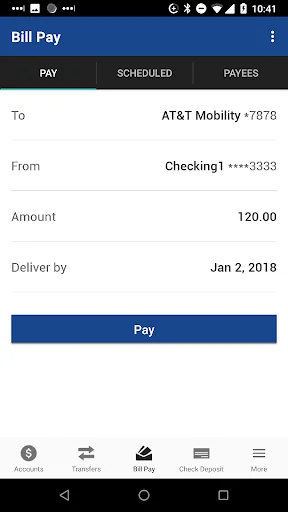
• Pay bills
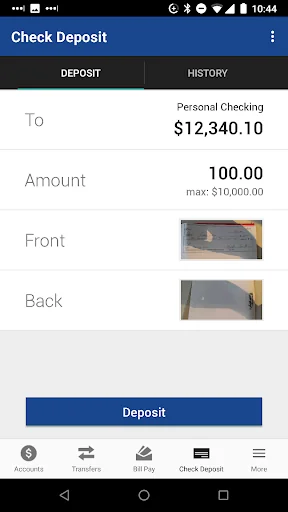
• Deposit checks
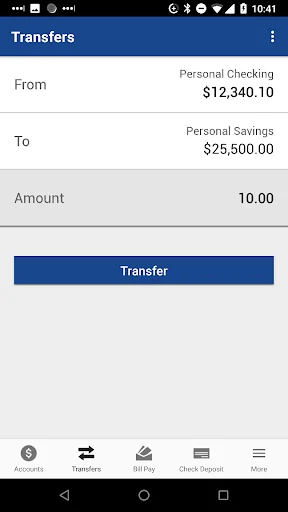
• Transfer money between L&N accounts
• Locate L&N branches and ATMs
• Check rates, apply for a loan & more!
To use L&N FCU Mobile, you must be an L&N member and enrolled in our Internet Banking service. To sign up, visit…
Each forecast combines App Store rating, ratings count, monetisation model, pricing tier, IAP signals and ad-supported flag.
The base estimate is then multiplied by a per-category scaling factor learned from apps with founder-verified MRR.
Every number on this page comes from public APIs and bumetric's own snapshot history.
Full methodology covers input variables, accuracy bands per category and how we treat apps without comparable anchors.
See also the live data on L&N FCU Mobile's tracker page for current rating, reviews and snapshot timeline.
Building something similar? Get a free AI audit with $-revenue forecasts for every recommendation.

 Citi Handlowy
 PenAir CU Mobile
 uwallet
 IZA
IZA
 BNZ Mobile