LaCollage makes taking new inventory collages a breeze! Create collages for outfits or single items.
How does it work?
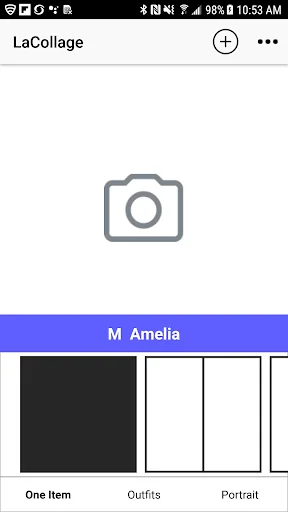
- Select a fun collage template
- You take pictures of your inventory
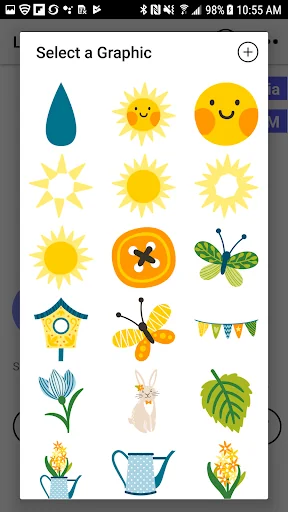
- Personalize the collage by placing some stickers
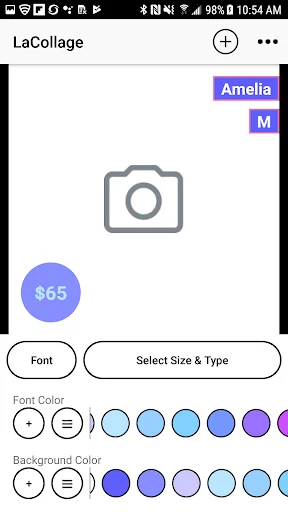
- We automatically generate beautiful collages with the item's type, size, and your watermark
- Sync your collage directly to Sonlet/ShopTheRoe, Dropbox, and/or the Camera Roll on your phone
- You can then easily use them in your customer parties!
N…
LaCollage makes taking new inventory collages a breeze! Create collages for outfits or single items.
How does it work?
- Select a fun collage template
- You take pictures of your inventory
- Personalize the collage by placing some stickers
- We automatically generate beautiful collages with the item's type, size, and your watermark
- Sync your collage directly to Sonlet/ShopTheRoe, Dropbox, and/or the Camera Roll on your phone
- You can then easily use them in your customer parties!
Never has taking new inventory photos been so easy and painless. Forget the days of having to type out the text for each and every collage.
Additional Features:
- Upload collages directly to your Sonlet/ShopTheRoe account
- Outfits or single items
- Custom colors
- Place stickers on your collages
- Use photos already on your phone
- Customize fonts and colors
- Image editing
- Show/hide item price and customized pricing
- Photos are uploaded to your Dropbox account or saved to your phone or both
- You can customize the watermark text
- Photos on Dropbox get automatically organized in type and size folders
- Choose low or high quality image output
- You may sign up for LaCollage Pro monthly or yearly subscription which includes:
- Sync collages to Sonlet/ShopTheRoe
- All templates and outfits with new monthly
- All stickers with new monthly
- You may sign up for LaCollage Plus monthly or yearly subscription which includes:
- Select templates and outfits with new monthly
- Select stickers with new monthly
Comparable Android apps
The five apps in Business with the closest revenue to LaCollage. Click any to see its detail page.
Each forecast combines App Store rating, ratings count, monetisation model, pricing tier, IAP signals and ad-supported flag.
The base estimate is then multiplied by a per-category scaling factor learned from apps with founder-verified MRR.
Every number on this page comes from public APIs and bumetric's own snapshot history.
Full methodology covers input variables, accuracy bands per category and how we treat apps without comparable anchors.
See also the live data on LaCollage's tracker page for current rating, reviews and snapshot timeline.
Building something similar? Get a free AI audit with $-revenue forecasts for every recommendation.

 Ubaar
Ubaar
 Rotaready
 Bloom
Bloom
 Startup Space
 LogicPaq