<i>For Android 5.0 and above.</i>
Find support for your Lenovo PC, tablet, smartphone, data center, and other Lenovo and Motorola devices. Quickly find solutions, view your warranty status and device information, optimize your phone, find your nearest service provider, check your repair status, and more.
<b>Your ‘One-Stop’ Lenovo app</b>
Lenovo Help can be installed on any Android-based device. You can even use our diagnostics and optimized features to troubleshoot issues with most of…
Find support for your Lenovo PC, tablet, smartphone, data center, and other Lenovo and Motorola devices. Quickly find solutions, view your warranty status and device information, optimize your phone, find your nearest service provider, check your repair status, and more.
Your ‘One-Stop’ Lenovo app
Lenovo Help can be installed on any Android-based device. You can even use our diagnostics and optimized features to troubleshoot issues with most of your Android devices, regardless of brand.
What’s New • Have access to Lenovo product shop and services, all in one place
• Reorganize original Lenovo Support features
• Add a new 'Shop' section allowing users to explore, search, and purchase Lenovo products
• Integrate a unified Lenovo account in the new 'Me' section
• Update new UI
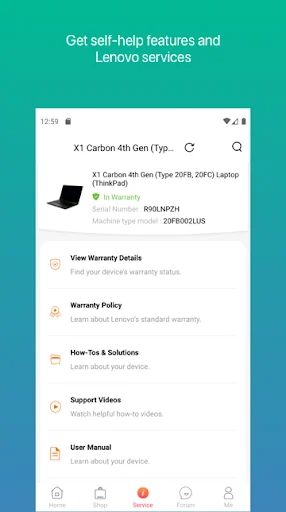
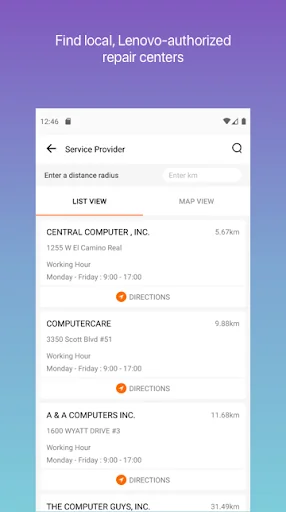
Service • Need repair? Use our Service Provider Lookup feature to find your nearest service provider’s contact information, as well as location information via Google Maps. Then use the app to open a service ticket (select countries and products).
• Check the status of your repair (select countries, PC products only).
• Check your device’s warranty status and update your warranty end date by scanning proof of purchase documentation and submitting to our agents (select countries and products).
• Chat with one of our knowledgeable agents from within the app (Lenovo smartphones in India only).
• Find solution articles and videos to help you use your device more effectively and troubleshoot problems. Provide feedback directly to Lenovo about the article’s effectiveness.
• Having an issue with your Android smartphone or tablet? Run simple or game self-diagnostics on each component to help you identify the problem. Test your display, battery health and temperature, touch screen, sound, cameras, Wi-Fi, GPS, Bluetooth, and more. Works on any Android device! Game tests are available on speaker and microphone tests only
• View important information about your Android smartphone or tablet, such as CPU, RAM, and storage usage, model and IMEI information, and software statistics.
• Access Lenovo’s Support website and Community Forums within the app.
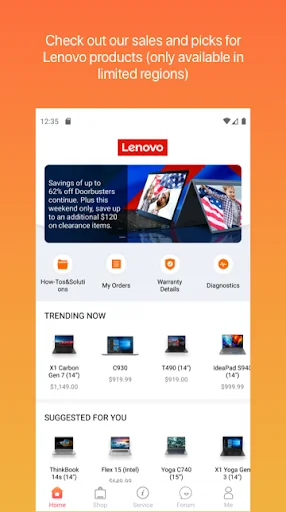
Shop • Now you can explore, search, and purchase Lenovo products in your app!
• Check our picks of Lenovo products and special campaigns
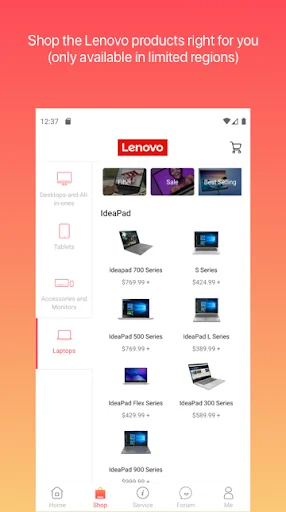
• Explore all Lenovo products by categories, brands and series
• Filter and sort by product specs to easily find exactly the product you need
• Browse a list of bestsellers and sales
• The shopping feature is only available in limited countries and regions. We're now working hard to expand it to more regions
My Account • Log in with Lenovo ID to access your unified Lenovo account
• Your history orders and shopping cart
• Your saved products from Lenovo’s Support website.
• Manage your Lenovo profile, wallet, and address book
We welcome your feedback about our app!
Please use the "About" option in the main menu of the app or leave us a comment here to let us know what you think.
NOTE: We cannot respond to product support requests or product complaints through Google Play comments or our in-app surveys.
Permissions requested by Lenovo Help • Phone: Identify your Lenovo device’s Serial Number and IMEI. The app will never make phone calls.
• Your location: Set your location to get relevant service options, run diagnostics on your GPS sensor, and find your nearest service provider.
• Camera: Run diagnostics on your camera(s).
• Microphone: Run diagnostics on your microphone.
• Storage: Cache solution article images locally on your device for faster retrieval.
Comparable Android apps
The five apps in Tools with the closest revenue to Lenovo. Click any to see its detail page.
Each forecast combines App Store rating, ratings count, monetisation model, pricing tier, IAP signals and ad-supported flag.
The base estimate is then multiplied by a per-category scaling factor learned from apps with founder-verified MRR.
Every number on this page comes from public APIs and bumetric's own snapshot history.
Full methodology covers input variables, accuracy bands per category and how we treat apps without comparable anchors.
See also the live data on Lenovo's tracker page for current rating, reviews and snapshot timeline.
Building something similar? Get a free AI audit with $-revenue forecasts for every recommendation.
 Document to PDF converter
 Furnicraft Furniture Mod
 Zoner AntiVirus
 Photo Lock
 Galaxy Sensors