ML revenue forecast.
Calibrated against 27694 apps in this category.
Confidence band
±15%
High — many comparable apps with verified data
At a glance
Earns 3.39× more than the category median (149/mo).
Ranks #2,632 of 27,694 in Arcade (top 9.5% by revenue).
Launched Sep 02, 2017 · last updated May 10, 2026.
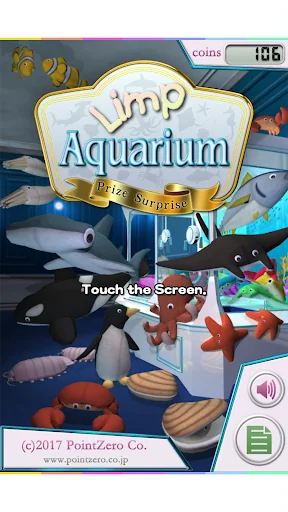
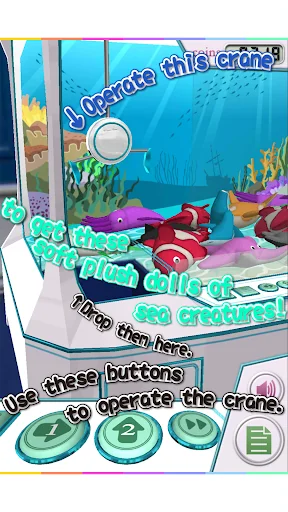
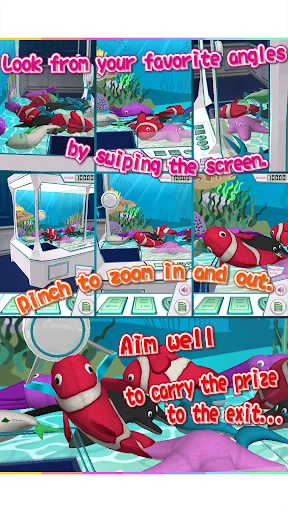
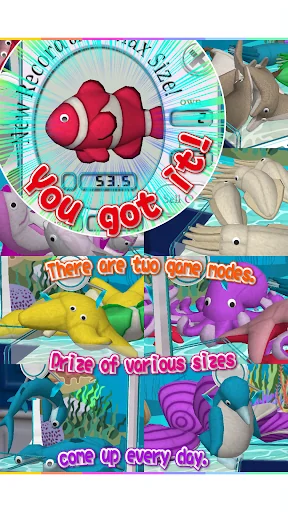
What the app looks like
Live screenshots from the Play Store, captured by our snapshot worker. Tap any image to enlarge.
Limp Aquarium's revenue trajectory
Forecast revenue from snapshot history. Last 1 months.
Where Limp Aquarium sits in Arcade
Revenue distribution of 27694 comparable apps. Limp Aquarium highlighted.
Limp Aquarium vs comparable apps
Revenue trajectory side-by-side. Bold = Limp Aquarium, ghosted = peers.
App spec
Version
1.20.021
Last update
May 10, 2026
Launched
Sep 02, 2017
Price
Free
Monetization
Free
What Limp Aquarium actually does (from store listing)
Celebrating 9 years, thanks to you!
It's virtual, so you can get them as much as you want!
A real claw crane game is reproduced to your smart phone.
This is the 6th of the series that everyone over 7,000,000 people are enjoying.
The special feature in this time is googly eyes.
Those limp stuffed toys now have cute swinging eyes.
The theme is various sea creatures. Pretty crownfish, cool scary sharks, shy clams and so on. The ones which you are familiar with in aquariums or at dining tables…
Celebrating 9 years, thanks to you!
It's virtual, so you can get them as much as you want!
A real claw crane game is reproduced to your smart phone.
This is the 6th of the series that everyone over 7,000,000 people are enjoying.
The special feature in this time is googly eyes.
Those limp stuffed toys now have cute swinging eyes.
The theme is various sea creatures. Pretty crownfish, cool scary sharks, shy clams and so on. The ones which you are familiar with in aquariums or at dining tables will welcome you with their funny eyes.
They are more than 430 kinds. And of course, going to increase still more by updating.
Also, not only the stuffed animals but also the background graphics are improved. They are shiny with the latest technology and became more refined.
The operation is simple. Just keep pressing the movement buttons and release them at good timings. Swipe the screen to look at the prizes from any angle you like.
Let's revenge to the game arcades which makes it hard to get prizes. Take so many prizes to your heart's content.
For more of our games, please visit our website at: https://pointzero.co.jp
Comparable Android apps
The five apps in Arcade with the closest revenue to Limp Aquarium. Click any to see its detail page.
Each forecast combines App Store rating, ratings count, monetisation model, pricing tier, IAP signals and ad-supported flag.
The base estimate is then multiplied by a per-category scaling factor learned from apps with founder-verified MRR.
Every number on this page comes from public APIs and bumetric's own snapshot history.
Full methodology covers input variables, accuracy bands per category and how we treat apps without comparable anchors.
See also the live data on Limp Aquarium's tracker page for current rating, reviews and snapshot timeline.
Building something similar? Get a free AI audit with $-revenue forecasts for every recommendation.
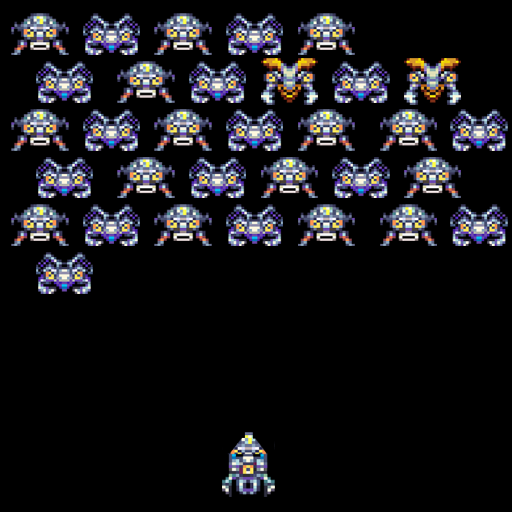 space game
 馬場風雲 5G
 New Year's Nail Salon
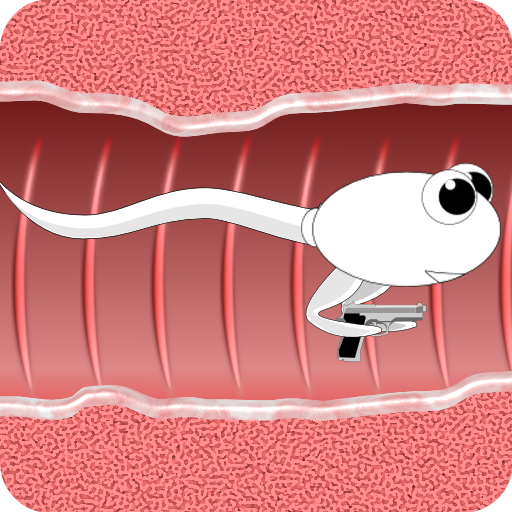 Sperm Game
 Swipe to go