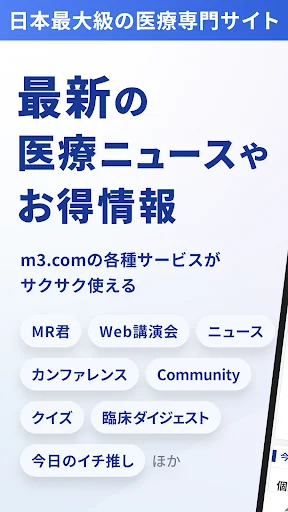
The m3.com app is Japan's largest dedicated healthcare professional app used by many doctors and pharmacists.
The m3.com app allows you to check medical information that is useful for daily medical care with easy, simple, and crisp operability.
Please use all means.
[Main functions]
◆ MR
・ Watch the latest medical information and drug information anytime, anywhere.
◆ Medical news
・ Deliver the latest daily medical news faster than newspapers.
・ Delivered the medical column "Medical…
The m3.com app is Japan's largest dedicated healthcare professional app used by many doctors and pharmacists.
The m3.com app allows you to check medical information that is useful for daily medical care with easy, simple, and crisp operability.
Please use all means.
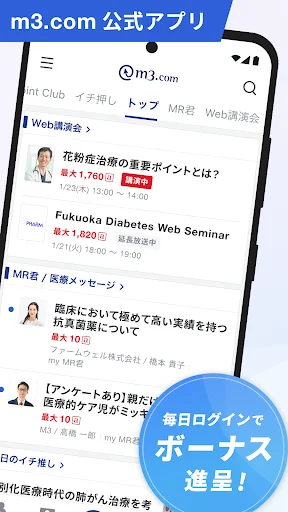
[Main functions]
◆ MR
・ Watch the latest medical information and drug information anytime, anywhere.
◆ Medical news
・ Deliver the latest daily medical news faster than newspapers.
・ Delivered the medical column "Medical Restoration" edited by m3.com.
◆ Pharmacist column
・ Pharmacist limited column. We deliver content that is useful for pharmacists' daily work and skill improvement, such as "Patient-specific medication guidance points" and "Pharmacist industry changes! Dispensing fee revision".
◆ Medicine carrier
・ It is a job change support service limited to pharmacists. We will inform you of the latest pharmacist job information.
◆ Doctors Community
・ Doctor-only bulletin board. We actively exchange opinions on a daily basis, focusing on specialized discussions such as diseases and treatment methods and current affairs information related to medical care.
◆ Conference
・ A doctor-only Q & A service that exchanges opinions on various problems encountered in clinical practice, such as diagnosis and treatment of diseases.
◆ Web lecture
・ Doctors can participate in lectures from home or work.
◆ Clinical digest
・ We will deliver the latest news useful for daily clinical practice.
◆ Quiz
・ Questions every day! You can learn medical knowledge in a quiz format.
◆ Questionnaire
・ You can check the answers to the questionnaire and the results of the attitude survey for healthcare professionals.
◆ Others
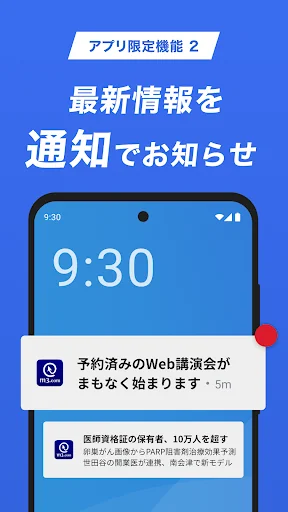
-Featured article notification function. You can receive featured article titles such as medical news and Doctors Community.
・ Campaign notification. You can receive advantageous campaign information.
-There is a widget function. You can quickly access MR and news without launching the app.
[Terms of use]
* This application is for medical professionals (mainly for doctors and pharmacists).
* To use it, you need to log in with your m3.com account.
* Please check the terms of use (http://www.m3.com/open/help/usageAgreement.shtml) before using this application.
Comparable Android apps
The five apps in Medical with the closest revenue to m3.com. Click any to see its detail page.
Each forecast combines App Store rating, ratings count, monetisation model, pricing tier, IAP signals and ad-supported flag.
The base estimate is then multiplied by a per-category scaling factor learned from apps with founder-verified MRR.
Every number on this page comes from public APIs and Bumetric's own snapshot history.
Full methodology covers input variables, accuracy bands per category and how we treat apps without comparable anchors.
See also the live data on m3.com's tracker page for current rating, reviews and snapshot timeline.
Building something similar? Get a free AI audit with $-revenue forecasts for every recommendation.


 MediVerse by MediCall
 Mediately Databáza Liekov
 Blood Sugar Diary for Diabetes
 BoardVitals Medical Exam Prep
 Safe Delivery