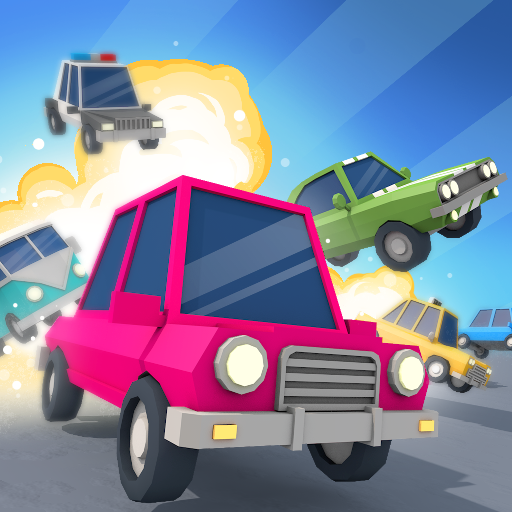
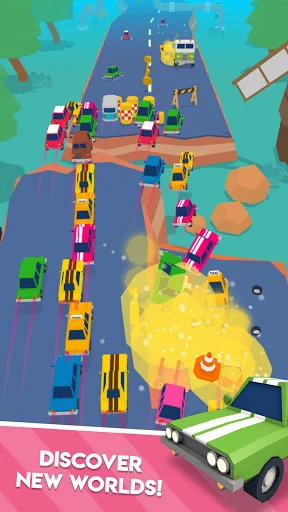
This year the cars have all gone mad.
Steer a bunch of cars on a highway without rules and try not to crash them, at least not all of them.
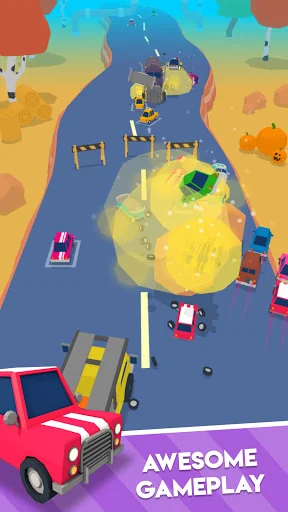
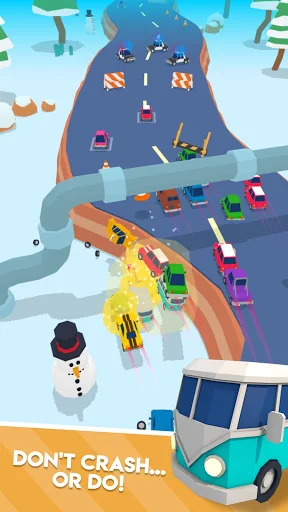
Fill the road with your hoard of cars and complete the fun levels. You'll be dodging rocks, pipes, holes in the road, trucks and many more, that will send chunks of your hoard of cars flying and explode.
Mad Cars features:
◉ Gameplay like no other
◉ Beautiful handmade 3d graphics
◉ Multiple environments to discover, including winter
◉ Various cars t…
This year the cars have all gone mad.
Steer a bunch of cars on a highway without rules and try not to crash them, at least not all of them.
Fill the road with your hoard of cars and complete the fun levels. You'll be dodging rocks, pipes, holes in the road, trucks and many more, that will send chunks of your hoard of cars flying and explode.
Mad Cars features:
◉ Gameplay like no other
◉ Beautiful handmade 3d graphics
◉ Multiple environments to discover, including winter
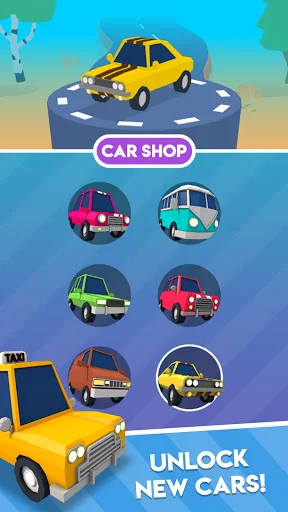
◉ Various cars to unlock
◉ Plenty of handcrafted levels
◉ Funky soundtrack
◉ Optimization for all screens
Comparable Android apps
The five apps in Racing with the closest revenue to Mad Cars. Click any to see its detail page.
Each forecast combines App Store rating, ratings count, monetisation model, pricing tier, IAP signals and ad-supported flag.
The base estimate is then multiplied by a per-category scaling factor learned from apps with founder-verified MRR.
Every number on this page comes from public APIs and bumetric's own snapshot history.
Full methodology covers input variables, accuracy bands per category and how we treat apps without comparable anchors.
See also the live data on Mad Cars's tracker page for current rating, reviews and snapshot timeline.
Building something similar? Get a free AI audit with $-revenue forecasts for every recommendation.
 Mad Hill Racing: Bluetooth
 Shopping Mall Car Driving
 Bike Striker
 The Infernus Paradise
 Monster Truck Fast Racing 3D