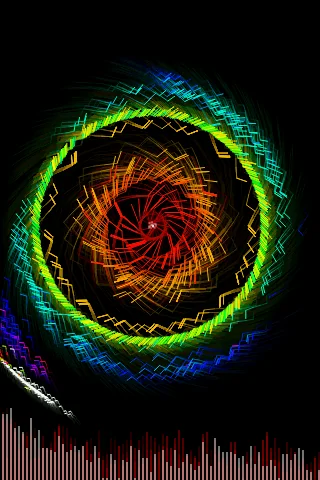
Control thousands of particles at the same time. With just a few simple movements, you can create awesome shapes that resemble space. Create and dispels great whirlwinds of particles, or simply watch their leisurely movements.
+ Relax and experiment!
+ There are a variety of manipulations, limited only by your imagination.
+ (Android 2.3.X and above) Turn on Vizualizer mode and enjoy the dance of particles up to your favorite music! Particles react on any playing sound
+ Choose any color
…
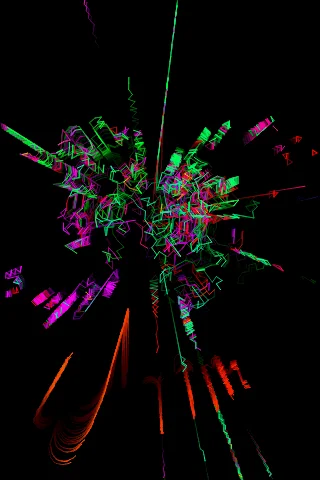
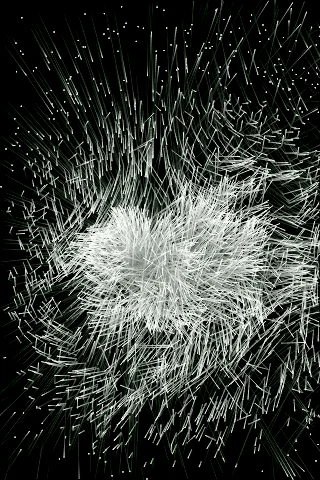
Control thousands of particles at the same time. With just a few simple movements, you can create awesome shapes that resemble space. Create and dispels great whirlwinds of particles, or simply watch their leisurely movements.
+ Relax and experiment!
+ There are a variety of manipulations, limited only by your imagination.
+ (Android 2.3.X and above) Turn on Vizualizer mode and enjoy the dance of particles up to your favorite music! Particles react on any playing sound
+ Choose any color
+ You can save your creation on Storage Card -> image\Magic Art.
+ Very small size, installation on Storage card
+ Without annoying in-game advertisement!
"Microphone" permission is needed to react to music from other music players - this is an Android requirement.
Comparable Android apps
The five apps in Entertainment with the closest revenue to Magic Art. Click any to see its detail page.
Each forecast combines App Store rating, ratings count, monetisation model, pricing tier, IAP signals and ad-supported flag.
The base estimate is then multiplied by a per-category scaling factor learned from apps with founder-verified MRR.
Every number on this page comes from public APIs and bumetric's own snapshot history.
Full methodology covers input variables, accuracy bands per category and how we treat apps without comparable anchors.
See also the live data on Magic Art's tracker page for current rating, reviews and snapshot timeline.
Building something similar? Get a free AI audit with $-revenue forecasts for every recommendation.


 U+모바일tv
 Partying - Games, chat, text
 U-verse
 Grand Criminal Cheats
 RTL+
RTL+