PURE ACTION
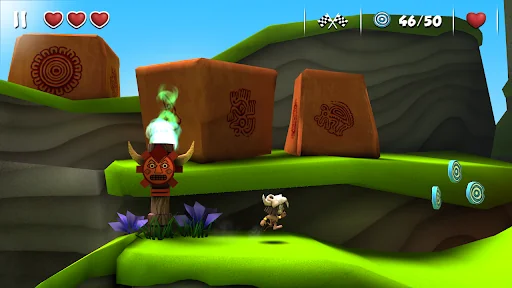
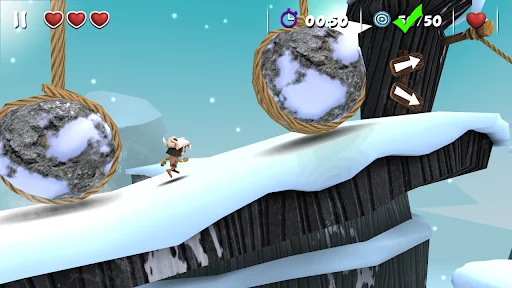
Run, jump and slide from ropes, dodge rocks! Not enough? There is much more in Manuganu. Avoid swinging hammers and jump over moving ice blocks. Don’t get burned and jump between walls to collect coins and medallions. Break stone blocks and activate platforms before you fall into fog and much more...
A RUNNING ADVENTURE
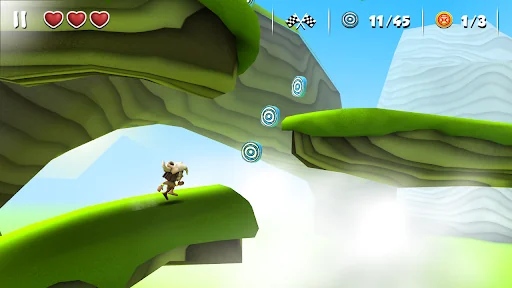
Manuganu is a 3D side- scroller running game, in which you control the boy “Manuganu”.
Unlike other usual running games, Manuganu brings on the “Halt featur…
Run, jump and slide from ropes, dodge rocks! Not enough? There is much more in Manuganu. Avoid swinging hammers and jump over moving ice blocks. Don’t get burned and jump between walls to collect coins and medallions. Break stone blocks and activate platforms before you fall into fog and much more...
A RUNNING ADVENTURE
Manuganu is a 3D side- scroller running game, in which you control the boy “Manuganu”.
Unlike other usual running games, Manuganu brings on the “Halt feature” to avoid swinging rocks, hammers, flames and other enemies with the right timing. Another important feature of Manuganu is the ability to switch from “running” mode to “rope climbing” mode when needed. But be careful! This mode has its own challenges.
GAME FEATURES
•Platforming Actions: Double Jumping, Wall Sliding, Hovering, Wall Jumping, Rolling, Breaking Stone Blocks
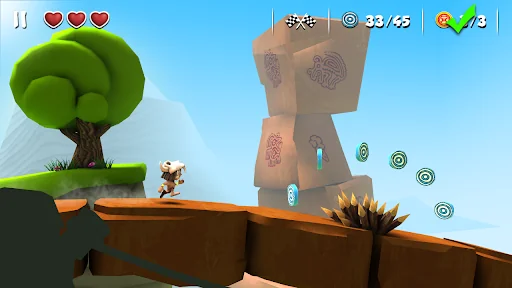
•Run through 30 different levels, each with it’s own unique design according to the level theme.
•Two button controls and specific swipe controls.
•Run into alternate paths to get 3 Star in all Levels.
•Three different environments with full 3D graphics.
•Original Soundtrack by Tolga YURDABAK
•Turkish-English Language Support
Comparable Android apps
The five apps in Arcade with the closest revenue to Manuganu. Click any to see its detail page.
Each forecast combines App Store rating, ratings count, monetisation model, pricing tier, IAP signals and ad-supported flag.
The base estimate is then multiplied by a per-category scaling factor learned from apps with founder-verified MRR.
Every number on this page comes from public APIs and bumetric's own snapshot history.
Full methodology covers input variables, accuracy bands per category and how we treat apps without comparable anchors.
See also the live data on Manuganu's tracker page for current rating, reviews and snapshot timeline.
Building something similar? Get a free AI audit with $-revenue forecasts for every recommendation.

 Potion Punch
 Draw Climber
 Galaxy Shooter: Air Force War
 Maze King
 Paper.io