Discord Chat: https://discord.gg/K2H2mhHm3X
Telegram Chat: @MAROONEDGAME
Reddit BBS: https://www.reddit.com/r/MaroonedGamer/
In the game,Players play role of Ed and survive in different enviornment of the world,such as Thailand Jungle, Philippine island,African Plain and etc. You will have no tools,no clothes,no food,no water,and not even a knife.Despite such condition,dogged Ed can still overcome the harsh environment and live well.
【Game Features】
->So large area
The area is very larg…
Discord Chat: https://discord.gg/K2H2mhHm3X
Telegram Chat: @MAROONEDGAME
Reddit BBS: https://www.reddit.com/r/MaroonedGamer/
In the game,Players play role of Ed and survive in different enviornment of the world,such as Thailand Jungle, Philippine island,African Plain and etc. You will have no tools,no clothes,no food,no water,and not even a knife.Despite such condition,dogged Ed can still overcome the harsh environment and live well.
【Game Features】
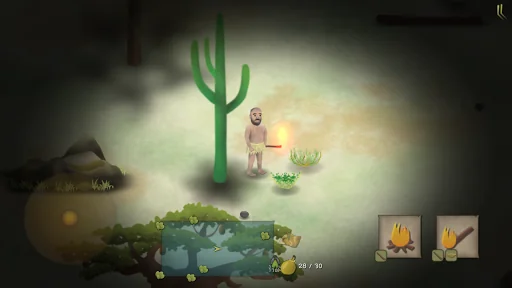
->So large area
The area is very large in each scene.You can set up a camp and make a campfire anywhere.You can put traps where you think it is easy to catch animals. When raining,you can use containers to hold water.When you can see nothing in the dark night,you can use torch to help you.
->Search secret tasks in the game
There are two secret missions in each scene. You need to find it by yourself .Sometimes it will appear under specical conditions.You will get special gifts after completing the main task and hidden tasks.
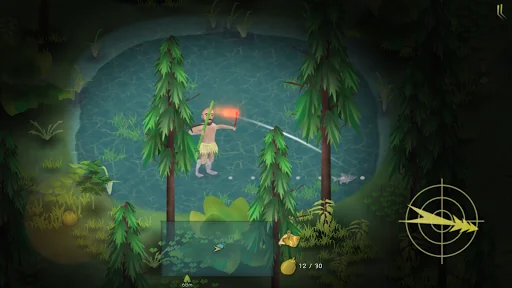
->Catch and hunt is skilled work
There are many throwing tools in the game,such as stones,bamboo forks,and bows and arrows.Sometimes you will run into preys ,such as the rabbits on grassland,the fishes in the pond and etc. You need to use different tools to catch them.
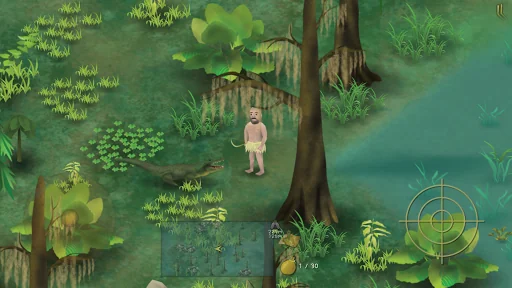
->How to do when you face a large dangerous animial?
When you survive several days,sometimes you will run into some large dangerous animials,such as the wolfs in the Thailand Jungle,the hyenas on African Grassland,and the crocodiles in the Marshland. If you have throwing tools ,you can hit them.Otherwise ,you ‘d better run as fast as you can.
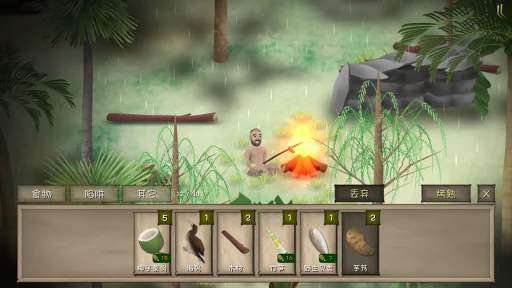
->Temptation of food
You can cook in each scene. You need to collect different kinds of food first. The long you survived , more dishes you must need to improve your health.
Comparable Android apps
The five apps in Adventure with the closest revenue to Marooned. Click any to see its detail page.
Each forecast combines App Store rating, ratings count, monetisation model, pricing tier, IAP signals and ad-supported flag.
The base estimate is then multiplied by a per-category scaling factor learned from apps with founder-verified MRR.
Every number on this page comes from public APIs and bumetric's own snapshot history.
Full methodology covers input variables, accuracy bands per category and how we treat apps without comparable anchors.
See also the live data on Marooned's tracker page for current rating, reviews and snapshot timeline.
Building something similar? Get a free AI audit with $-revenue forecasts for every recommendation.

 Zombie Attack
 Railway Station Craft
 Super Troll: Endless Running
 Dreadnite: Online Horror Fear
 Memento: crime investigation