What Mars: Mars actually does (from store listing)
MarsCorp wants YOU to explore the secrets of the red planet in an exciting low-gravity endless indie game!
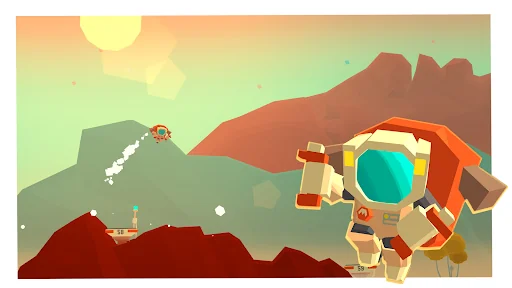
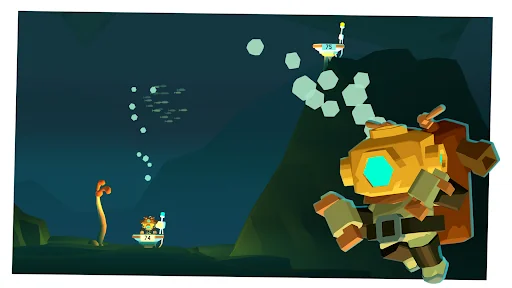
MarsCorp is ready to take the first group of volunteers on an exciting mission to Mars! Fly around Mars in one of our brand new jetpacks and discover what’s out there in a unique exploration endless adventure.
As part of the “Put A Human On Mars No Matter What” program, we are proud to announce that MarsCorp is the first company cutting enough corners to make human flights to Mars fin…
MarsCorp wants YOU to explore the secrets of the red planet in an exciting low-gravity endless indie game!
MarsCorp is ready to take the first group of volunteers on an exciting mission to Mars! Fly around Mars in one of our brand new jetpacks and discover what’s out there in a unique exploration endless adventure.
As part of the “Put A Human On Mars No Matter What” program, we are proud to announce that MarsCorp is the first company cutting enough corners to make human flights to Mars finally viable. Our jetpacks are 100% Mars approved. You will survive!
The so-called “professional” astronauts will tell you things like “No sane person would travel across space on that thing” or “The fuel on that jetpack lasts about 30 seconds”, but you can prove them wrong and survive! Here’s your chance to make history!
By the way, we should probably mention that this exploration indie game is not completely endless, but it’s your job to find the finish line!
- Live your exploration dreams on Mars’s lands on a jetpack.
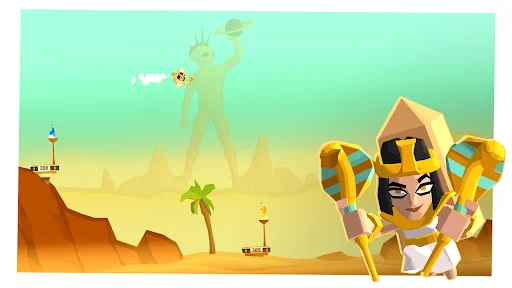
- Take selfies on Mars's greatest sightings.
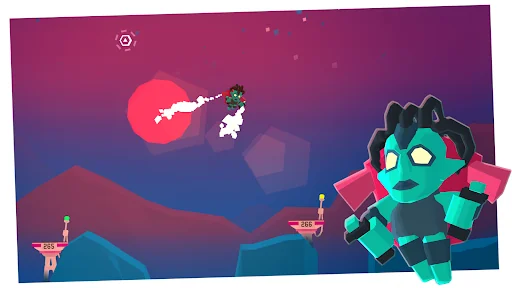
- Avoid Rapid Unscheduled Jetpack Disassemblies.
- Survive!
- And most importantly, have fun!
---
Learn more about our games:
http://www.pomelogames.com/
Follow us to get news:
https://www.facebook.com/pomelogames/
https://twitter.com/pomelogames
https://instagram.com/pomelogames
Comparable Android apps
The five apps in Action with the closest revenue to Mars: Mars. Click any to see its detail page.
Each forecast combines App Store rating, ratings count, monetisation model, pricing tier, IAP signals and ad-supported flag.
The base estimate is then multiplied by a per-category scaling factor learned from apps with founder-verified MRR.
Every number on this page comes from public APIs and bumetric's own snapshot history.
Full methodology covers input variables, accuracy bands per category and how we treat apps without comparable anchors.
See also the live data on Mars: Mars's tracker page for current rating, reviews and snapshot timeline.
Building something similar? Get a free AI audit with $-revenue forecasts for every recommendation.

 Dead Warfare 2: Zombie Shoot
 Mutant Fighting Cup 2
 Super Penguins
 Last Hope Sniper 2: Zombie War
 Xenowerk