MASN is the official regional sports network for the Baltimore Orioles, delivering live games, original programming, and on-demand content to fans across the Mid-Atlantic region.
The network is available across a seven-state territory—from Harrisburg, Pennsylvania, to Charlotte, North Carolina—on multiple cable and fiber-optic providers, and is also televised nationally via satellite provider Direct TV.
Since launching a full-time 24/7 schedule in July 2006, MASN has televised hundreds of …
MASN is the official regional sports network for the Baltimore Orioles, delivering live games, original programming, and on-demand content to fans across the Mid-Atlantic region.
The network is available across a seven-state territory—from Harrisburg, Pennsylvania, to Charlotte, North Carolina—on multiple cable and fiber-optic providers, and is also televised nationally via satellite provider Direct TV.
Since launching a full-time 24/7 schedule in July 2006, MASN has televised hundreds of professional and NCAA Division I collegiate events each year.
MASN’s Emmy Award–winning Orioles coverage provides extensive access to fans throughout the region. The network has consistently enhanced the viewing experience through advanced in-game production features, including super slow-motion cameras and pitch-tracking technology.
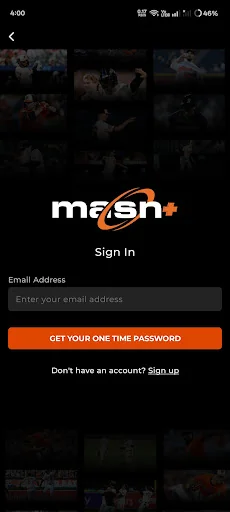
With a 24/7 live channel, intuitive navigation, and secure TV-provider authentication, the MASN app keeps you connected to Orioles baseball and regional sports programming anytime, anywhere.
MASN believes every fan in the region should be able to watch Orioles baseball. To support this, the network offers fair and reasonable carriage terms to cable and satellite distributors throughout its television territory.
MASN is currently available on providers including Armstrong, Bay Country, Breezeline, Comcast Xfinity, Cox, DirectTV, Easton Velocity, Lumos TV, Mediacom, Scout, and Verizon Fios.
Live Sports Coverage
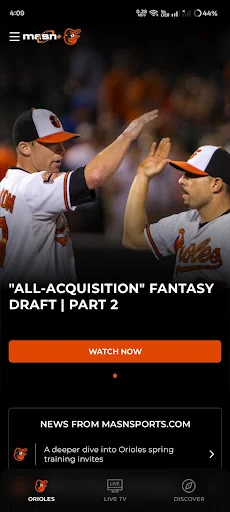
1. Live Baltimore Orioles games all season long, in HD. Includes O’s Xtra pre- and post-game coverage from Oriole Park at Camden Yards.
2. Orioles Classics and Orioles Minor League Affiliate games.
3. All other MASN programming such as live college football and basketball, boxing, MMA, horse racing, and more.
App Features
1. 24/7 live MASN channel.
2. Video on Demand – postgame clips and featured programming.
3. Channel guide for upcoming content.
4. Watch on mobile and supported TV platforms.
5. Secure TV provider authentication.
Comparable Android apps
The five apps in Sports with the closest revenue to MASN. Click any to see its detail page.
Each forecast combines App Store rating, ratings count, monetisation model, pricing tier, IAP signals and ad-supported flag.
The base estimate is then multiplied by a per-category scaling factor learned from apps with founder-verified MRR.
Every number on this page comes from public APIs and Bumetric's own snapshot history.
Full methodology covers input variables, accuracy bands per category and how we treat apps without comparable anchors.
See also the live data on MASN's tracker page for current rating, reviews and snapshot timeline.
Building something similar? Get a free AI audit with $-revenue forecasts for every recommendation.



 VR Pool
 Coates Talent League
 Soccersuck ข่าวบอล ผลบอล
 Polar Equine App
 FidoDarts