What MBL Rainbow actually does (from store listing)
Mercantile Bank Digital Banking Platform: "MBL Rainbow". For facilitating banking customers with various types of transactions, make payment, purchase online, transfer funds, top-up mobiles etc. from anywhere, anytime by using smartphones-Mercantile Bank Limited brings MBL Rainbow to color your Banking life.
Features:
• Digital on-boarding facilities (you don’t need to fill-up form/visit any branch/call to contact center)
• e-KYC verification with a very convenient way
• Digitize your accou…
Mercantile Bank Digital Banking Platform: "MBL Rainbow". For facilitating banking customers with various types of transactions, make payment, purchase online, transfer funds, top-up mobiles etc. from anywhere, anytime by using smartphones-Mercantile Bank Limited brings MBL Rainbow to color your Banking life.
Features:
• Digital on-boarding facilities (you don’t need to fill-up form/visit any branch/call to contact center)
• e-KYC verification with a very convenient way
• Digitize your account with a very fast, secure and convenient way
• Opening MBL Account through Rainbow App
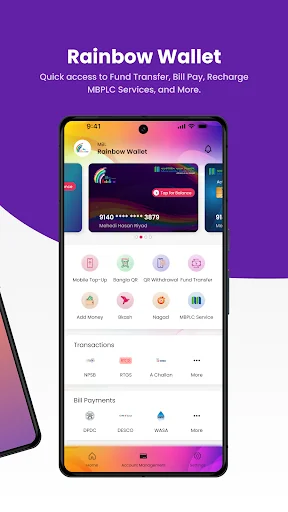
• Add Money from any Bank's VISA/Amex/Master Card
• e-Commerce Transaction
• Automated Challan Payment (A-Challan)
• Real time Funds Transfer within the MBPLC
• Interbank Fund Transfer - BEFTN / RTGS / NPSB
• MFS Fund Transfer - bKash / Nagad
• Credit & Prepaid Card Bill Payment
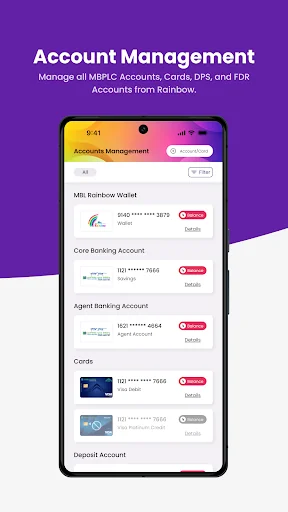
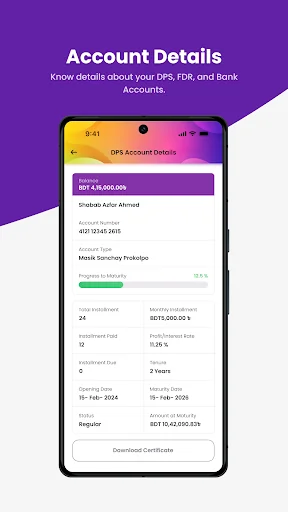
• View all of your accounts with balance
• View account summary
• Mobile top-ups
• Pay utility bills
• QR Branch cash withdrawal
• BanglaQR Merchant Payment
• Locate branches and ATMs
• Many more digital ways of doing banking.
Comparable Android apps
The five apps in Finance with the closest revenue to MBL Rainbow. Click any to see its detail page.
Each forecast combines App Store rating, ratings count, monetisation model, pricing tier, IAP signals and ad-supported flag.
The base estimate is then multiplied by a per-category scaling factor learned from apps with founder-verified MRR.
Every number on this page comes from public APIs and bumetric's own snapshot history.
Full methodology covers input variables, accuracy bands per category and how we treat apps without comparable anchors.
See also the live data on MBL Rainbow's tracker page for current rating, reviews and snapshot timeline.
Building something similar? Get a free AI audit with $-revenue forecasts for every recommendation.

 Apex Bank
 Amex Taiwan
 Bridge2Capital
 BEKB smartLogin
 SG Connect