∵∴ Google Indie Games Festival 2019 Top 3 Award Winner ∴∵
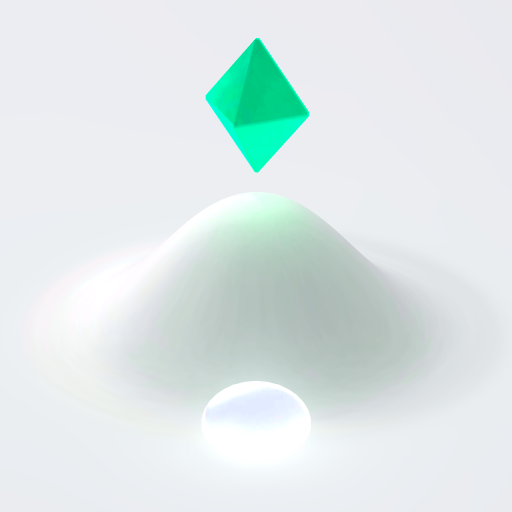
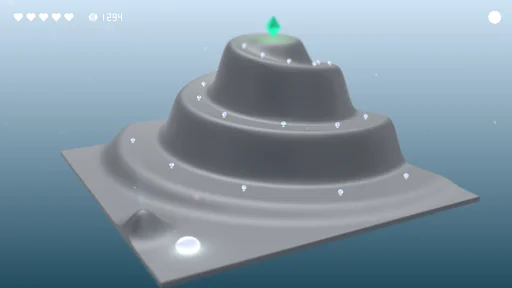
Roll the droplet by pushing up the melted ground! New sense Rolling Ball Game.
This game is a bit difficult, and you will be tested the calm of your heart.
It is a mysterious melted world...
All you can do is to push up the ground from below.
Carefully to avoid falling, sometimes boldly roll the droplet and aim for the goal!
[ How to Play ]
1, Stroking the screen with your finger will bulge the ground and you can move it.
2, …
∵∴ Google Indie Games Festival 2019 Top 3 Award Winner ∴∵
Roll the droplet by pushing up the melted ground! New sense Rolling Ball Game.
This game is a bit difficult, and you will be tested the calm of your heart.
It is a mysterious melted world...
All you can do is to push up the ground from below.
Carefully to avoid falling, sometimes boldly roll the droplet and aim for the goal!
[ How to Play ]
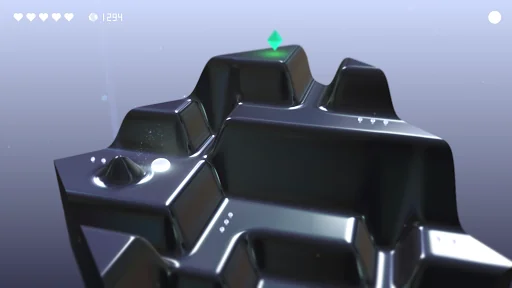
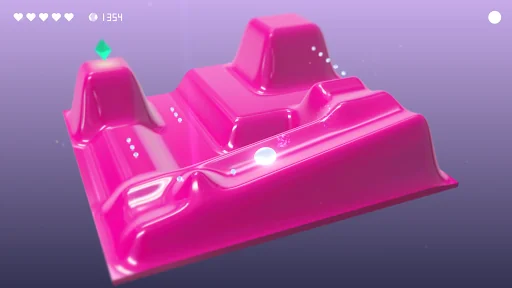
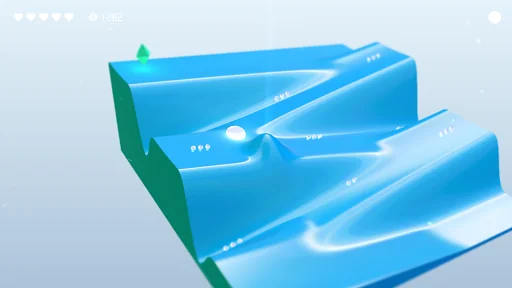
1, Stroking the screen with your finger will bulge the ground and you can move it.
2, Carry the droplet to the goal carefully and gently so as not to fall from the field.
3, Ripples spread by tapping.
4, Collect gems as much as possible. It is interchangeable with lives.
News & Support:
@m_hakozaki on Twitter
Comparable Android apps
The five apps in Casual with the closest revenue to MeltLand. Click any to see its detail page.
Each forecast combines App Store rating, ratings count, monetisation model, pricing tier, IAP signals and ad-supported flag.
The base estimate is then multiplied by a per-category scaling factor learned from apps with founder-verified MRR.
Every number on this page comes from public APIs and bumetric's own snapshot history.
Full methodology covers input variables, accuracy bands per category and how we treat apps without comparable anchors.
See also the live data on MeltLand's tracker page for current rating, reviews and snapshot timeline.
Building something similar? Get a free AI audit with $-revenue forecasts for every recommendation.
 Mouth Care Doctor - Crazy Dent
 Diamond Run v3.0
 Magic Ball
 Destroy A Video Game Console
 Paint cars