Android app
from MCS Healthcare Holdings LLC
· Medical
ML forecast★ 2.2 · 1KFree
~232/mo
ML revenue forecast.
Calibrated against 13784 apps in this category.
Confidence band
±15%
High — many comparable apps with verified data
At a glance
Tracks close to the Android app category median (161/mo).
Ranks #4,032 of 13,784 in Medical (top 29.3% by revenue).
Launched Mar 19, 2019 · last updated Jan 09, 2026.
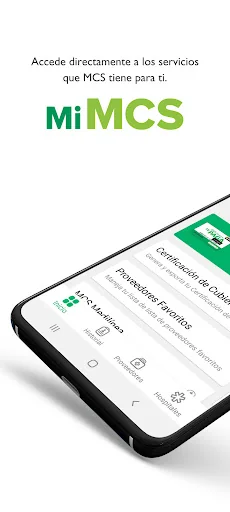
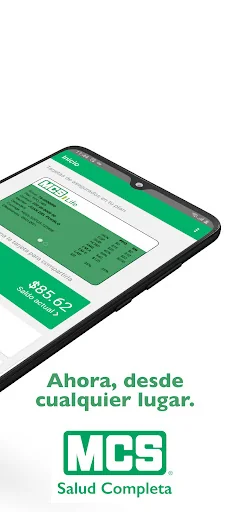
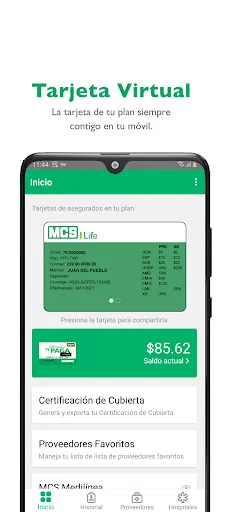
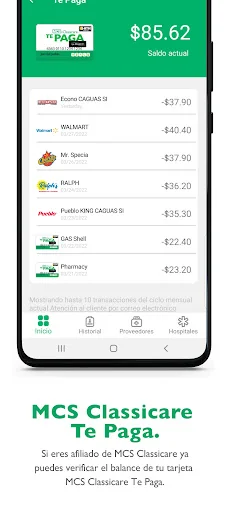
What the app looks like
Live screenshots from the Play Store, captured by our snapshot worker. Tap any image to enlarge.
Mi MCS's revenue trajectory
Forecast revenue from snapshot history. Last 1 months.
Where Mi MCS sits in Medical
Revenue distribution of 13784 comparable apps. Mi MCS highlighted.
Mi MCS vs comparable apps
Revenue trajectory side-by-side. Bold = Mi MCS, ghosted = peers.
App spec
Version
3.3.1
Last update
Jan 09, 2026
Launched
Mar 19, 2019
Price
Free
Monetization
Free
What Mi MCS actually does (from store listing)
Download the app and take advantage of the benefits available to you! With the My MCS app on your cell phone you can directly access the services you need from your health plan.
As an MCS member, you will find:
Virtual card
• Your plan card always with you on your cell phone.
Coverage Certification
• Get your certification letter from anywhere and send it to your healthcare provider.
Te Paga Balance
• Easy access to the balance on your MCS Classicare Te Paga card.
Provider directory
…
Download the app and take advantage of the benefits available to you! With the My MCS app on your cell phone you can directly access the services you need from your health plan.
As an MCS member, you will find:
Virtual card
• Your plan card always with you on your cell phone.
Coverage Certification
• Get your certification letter from anywhere and send it to your healthcare provider.
Te Paga Balance
• Easy access to the balance on your MCS Classicare Te Paga card.
Provider directory
• Find your healthcare providers by name, town, or specialty.
Favorite Suppliers
• Create your own provider directory by selecting your preferred doctors.
History of Medical Services
• Access your history of services received in dental, medical, pharmacy and laboratory visits.
Hospitals
• Identify the closest hospital and get there quickly using the browser on your cell phone.
Direct access to MCS Medilínea
• It is a free healthcare orientation and consultation service provided by graduated nurses, available 24 hours a day, 7 days a week
Direct access to MCS MedilíneaMD
• It provides you urgent care services through telemedicine - 24 hours a day, 7 days a week. You can request a video call with the next available doctor, and/or coordinate your appointment within a 24-hour period. You can make a phone call if you do not have a smartphone with a video camera.
Direct access to MCS TeleCare
• It is a service that provides members access to healthcare services with their primary care physicians and/or specialists without leaving their home. Through this application, you’ll be able to coordinate your virtual appointment. You’ll have the option to make a phone call if you do not have a smartphone with a video camera.
Comparable Android apps
The five apps in Medical with the closest revenue to Mi MCS. Click any to see its detail page.
Each forecast combines App Store rating, ratings count, monetisation model, pricing tier, IAP signals and ad-supported flag.
The base estimate is then multiplied by a per-category scaling factor learned from apps with founder-verified MRR.
Every number on this page comes from public APIs and bumetric's own snapshot history.
Full methodology covers input variables, accuracy bands per category and how we treat apps without comparable anchors.
See also the live data on Mi MCS's tracker page for current rating, reviews and snapshot timeline.
Building something similar? Get a free AI audit with $-revenue forecasts for every recommendation.
 AspiraHealth
 CLICKDOC – Arzttermine online
 Liixuos Medical Dictionary En
 Mindler
 CliniLingo: Medical Dictionary