The MiLB app is your official companion for Minor League Baseball, including all 120 clubs, from Triple-A to Single-A.
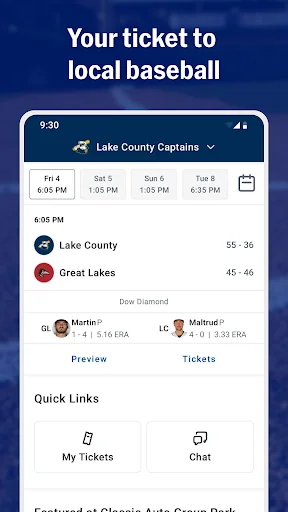
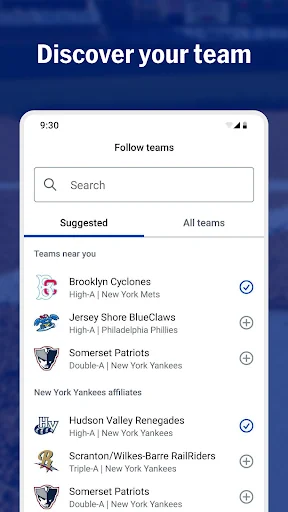
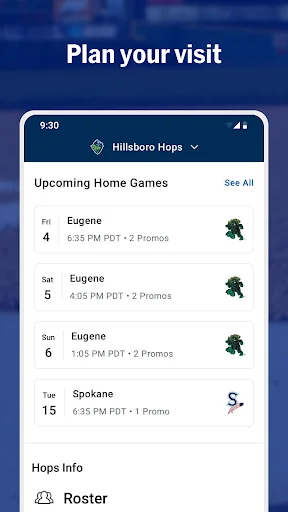
• Follow your local team and never miss a game or event.
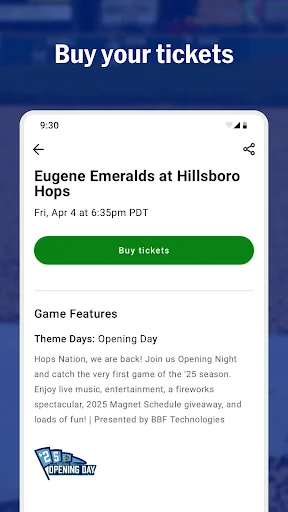
• Buy tickets, browse merchandise, and find promotions from your team tab.
• Enjoy a seamless ballpark experience with digital tickets and check-ins.
• Explore MiLB news and highlights, catch the latest on top prospects, or search teams and players across the league.
• Personalize your app experience with live game…
The MiLB app is your official companion for Minor League Baseball, including all 120 clubs, from Triple-A to Single-A.
• Follow your local team and never miss a game or event.
• Buy tickets, browse merchandise, and find promotions from your team tab.
• Enjoy a seamless ballpark experience with digital tickets and check-ins.
• Explore MiLB news and highlights, catch the latest on top prospects, or search teams and players across the league.
• Personalize your app experience with live game updates and breaking news.
• Follow the action with pitch-by-pitch updates on Gameday, along with live scores, stats, video highlights and notifications for all 120 teams.
SUBSCRIBE & GET EVEN MORE
More than 7,000 live MiLB games and complete archives are available with your MLB+ subscription. Your MLB+ subscription now includes audio streams for all MLB games & other live programming, available with log-in on MLB App and MLB.com.
Each forecast combines App Store rating, ratings count, monetisation model, pricing tier, IAP signals and ad-supported flag.
The base estimate is then multiplied by a per-category scaling factor learned from apps with founder-verified MRR.
Every number on this page comes from public APIs and bumetric's own snapshot history.
Full methodology covers input variables, accuracy bands per category and how we treat apps without comparable anchors.
See also the live data on MiLB's tracker page for current rating, reviews and snapshot timeline.
Building something similar? Get a free AI audit with $-revenue forecasts for every recommendation.
 R-navi
 馬場Boss
 MyOutdoorTV: Hunt, Fish, Shoot
 Pasión Tricolor
 Jeep Driving 3D : Jeep Game 3D