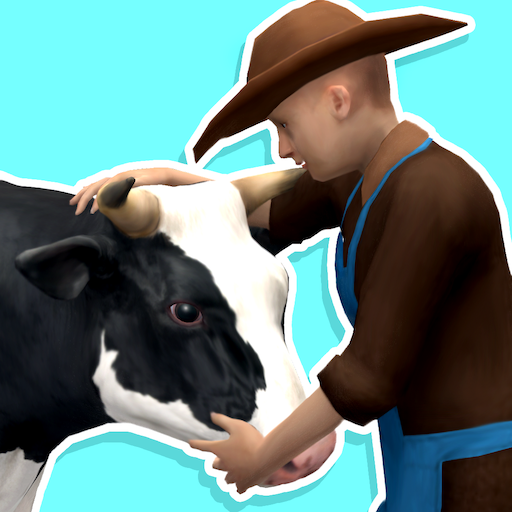
Start with a small farm, breed cows, build factories, and become a Dairy Tycoon! Your goal is to feed your cows, grow your farm one cow at a time and make tons of money daily. Are you ready to take your Milk Empire to the next level?
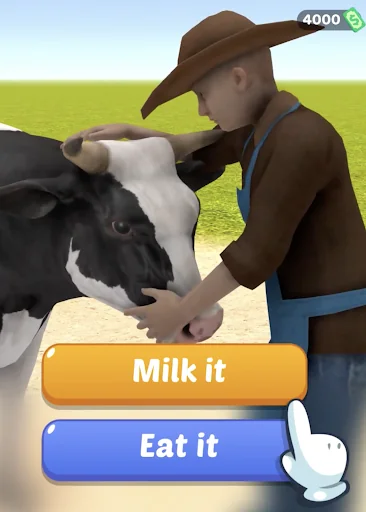
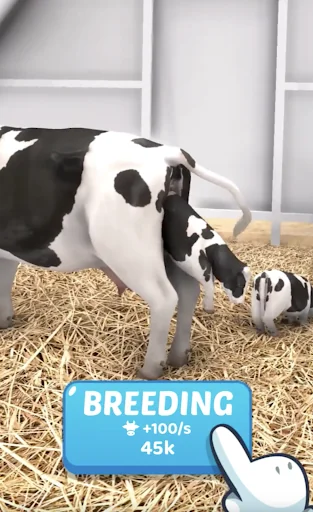
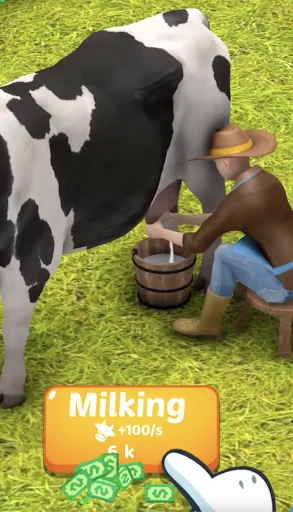
Feed your cows, milk them, breed them and watch them multiply! Turn your small farm into a farmville, build factories, acquire trucks and open a mega milk supermarket! Become a Milk Tycoon!
Sell your milk to all the neighboring towns, build a milk empire and…
Start with a small farm, breed cows, build factories, and become a Dairy Tycoon! Your goal is to feed your cows, grow your farm one cow at a time and make tons of money daily. Are you ready to take your Milk Empire to the next level?
Feed your cows, milk them, breed them and watch them multiply! Turn your small farm into a farmville, build factories, acquire trucks and open a mega milk supermarket! Become a Milk Tycoon!
Sell your milk to all the neighboring towns, build a milk empire and expand to cities! Why stop with just animals? Create milk products and continue the adventure, branch out into different businesses, till you reach the ultimate prestiges tycoon status.
Milk inc. is a casual fun simulator game, you can milk just about anything in your farm! Sheep? Chicken? Where do you think chocolate milk egg comes from? Cheese, chocolate, egg, ice-cream - you can have it all!
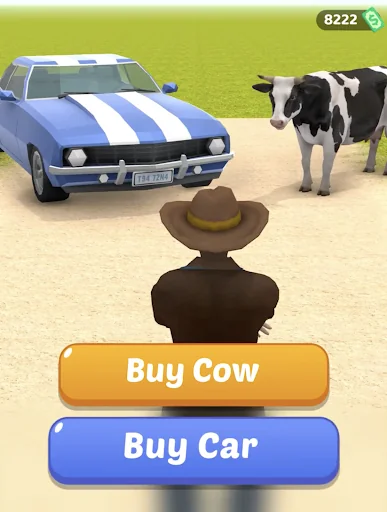
Play this free and incremental idle clicker game with colorful 3D graphics, tap to build and balance your resources, invest your money, build your army of cows and explore life to fullest, become a milk capitalist!
This fun farming idle game is one of the top simulation games! Live-out every cowboy and cowgirls dream farm life! Filled with cows, cheese, chocolate and ice cream factories, trucks, supermarkets, egg, chicken, sheep and much more... Build your very own dairy farm today!
Comparable Android apps
The five apps in Simulation with the closest revenue to Milk Inc.. Click any to see its detail page.
Each forecast combines App Store rating, ratings count, monetisation model, pricing tier, IAP signals and ad-supported flag.
The base estimate is then multiplied by a per-category scaling factor learned from apps with founder-verified MRR.
Every number on this page comes from public APIs and bumetric's own snapshot history.
Full methodology covers input variables, accuracy bands per category and how we treat apps without comparable anchors.
See also the live data on Milk Inc.'s tracker page for current rating, reviews and snapshot timeline.
Building something similar? Get a free AI audit with $-revenue forecasts for every recommendation.
 HealingAqua - My Aquarium
 Left【RPG】
 魔女の雑貨店ローズ
 Hungry Anaconda Snake Sim 3D 2
 The Fox