Android app
from MONALI PODDAR and ABHIJIT PODDAR
· Education
ML forecast★ 2.7 · 154Free
~212/mo
ML revenue forecast.
Calibrated against 120891 apps in this category.
Confidence band
±15%
High — many comparable apps with verified data
At a glance
Tracks close to the Android app category median (159/mo).
Ranks #39,500 of 120,891 in Education (top 32.7% by revenue).
Launched Apr 21, 2019 · last updated Jun 06, 2023.
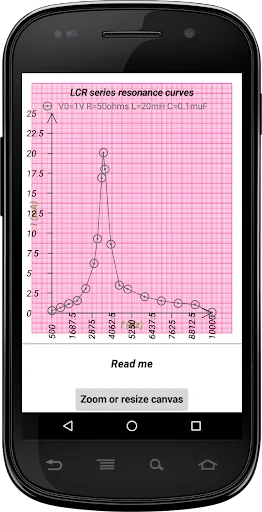
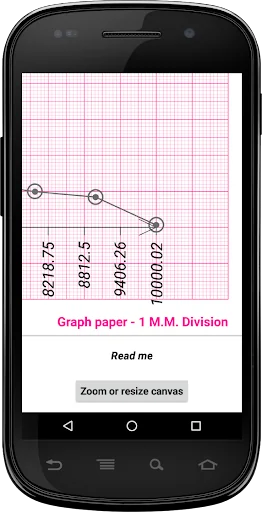
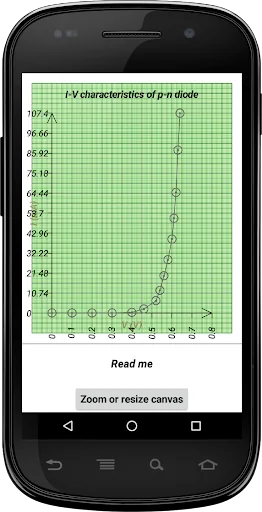
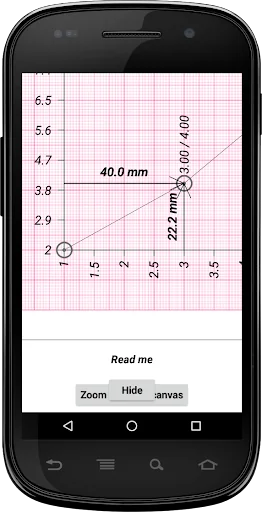
What the app looks like
Live screenshots from the Play Store, captured by our snapshot worker. Tap any image to enlarge.
mm Graph's revenue trajectory
Forecast revenue from snapshot history. Last 1 months.
Where mm Graph sits in Education
Revenue distribution of 120891 comparable apps. mm Graph highlighted.
mm Graph vs comparable apps
Revenue trajectory side-by-side. Bold = mm Graph, ghosted = peers.
App spec
Version
3.0
Last update
Jun 06, 2023
Launched
Apr 21, 2019
Price
Free
Monetization
Free
What mm Graph actually does (from store listing)
Welcome to "mm Graph", a free graph plotting android app to help you plot two-dimensional X-Y data on a mm-division graph-paper very easily.
If you are a student having difficulty in plotting your data on a millimeter-division graph paper, you should download the mm 'Graph app'. The app would guide you step by step in marking the data points on the mm-division graph paper, along with showing you all the relevant calculations.
If you want to accomplish more with the app, you need to get the…
Welcome to "mm Graph", a free graph plotting android app to help you plot two-dimensional X-Y data on a mm-division graph-paper very easily.
If you are a student having difficulty in plotting your data on a millimeter-division graph paper, you should download the mm 'Graph app'. The app would guide you step by step in marking the data points on the mm-division graph paper, along with showing you all the relevant calculations.
If you want to accomplish more with the app, you need to get the Pro version, namely 'mm Graph Pro', from Google Play Store.
With the Pro version, you may additionally:
* Draw your graph anywhere on the mm-division graph-paper by shifting the origin, by changing the axes-margins etc.
* Perform custom grid-scaling i.e. change the values corresponding to the smallest scale (1 mm) divisions along the X and Y axes.
* Import data already saved in files in your device into your app in different formats and different layouts. You may also edit the imported data before plotting.
* Make use of an embedded clock and stop-watch to take data readings which require a timer.
* Plot up to five sets of data, for e.g., five sets of drain-current versus drain-to-source voltage for different gate-to-source voltages in a JFET transistor.
* Plot as many data points as you wish.
* Orient the graph paper vertically or horizontally for an optimum plot.
* Even after a graph is drawn, you may edit X-Y values for a data point or delete a data point from the graph and replot.
* Modify the X and Y axis variables, for e.g., change X to log(X), Y to 1/Y etc.
* Insert text and arrow annotations on your graph to highlight important facets.
* Record the details of your lab-assignment related to the plotted graph.
* Save the full-sized e-graph (which exactly mimics an actual millimeter-division graph paper) with the plotted data into your mobile device.
* Also save the X-Y data set(s) to your device in different formats like .dat, .csv, .txt etc so that you may plot them later with your 'mm Graph Pro' app or any other graphing software if you so wish.
* Share your saved data and image files with your teacher, classmates, friends or anybody through WhatsApp or email from right inside the app.
* Get answers to 'Frequently asked questions'
And more ....
While students of all ages and disciplines are bound to find the app helpful, teachers too would find the app useful when checking graphs drawn by students with custom origins, custom graph-axes lengths and custom graph scales.
Comparable Android apps
The five apps in Education with the closest revenue to mm Graph. Click any to see its detail page.
Each forecast combines App Store rating, ratings count, monetisation model, pricing tier, IAP signals and ad-supported flag.
The base estimate is then multiplied by a per-category scaling factor learned from apps with founder-verified MRR.
Every number on this page comes from public APIs and bumetric's own snapshot history.
Full methodology covers input variables, accuracy bands per category and how we treat apps without comparable anchors.
See also the live data on mm Graph's tracker page for current rating, reviews and snapshot timeline.
Building something similar? Get a free AI audit with $-revenue forecasts for every recommendation.
 Middlesex University
 BlackSwan Audio
 ARMS COACHING INSTITUTE PVT.LT
 ABRSM Violin Practice Partner
 Armenian Russian Translator