1.2M Assets Tracked Updated 1 min ago Revenue Forecasts
Add an app Create Account Sign In
Home
MO Fishing icon

How much does MO Fishing earn?

Android app from Missouri Department of Conservation · Travel & Local

ML forecast ★ 2.7 · 374 Free

~304/mo

ML revenue forecast. Calibrated against 30046 apps in this category.

Confidence band
±15%
High — many comparable apps with verified data

At a glance

What the app looks like

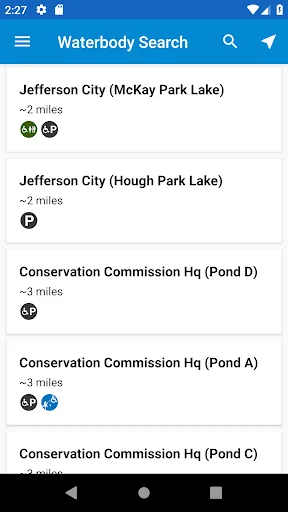
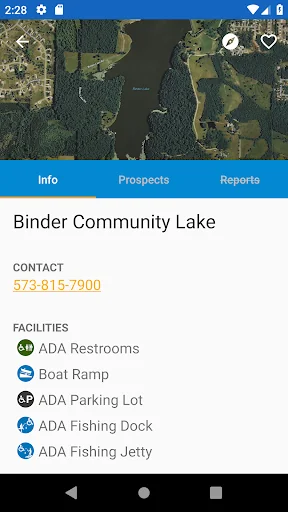
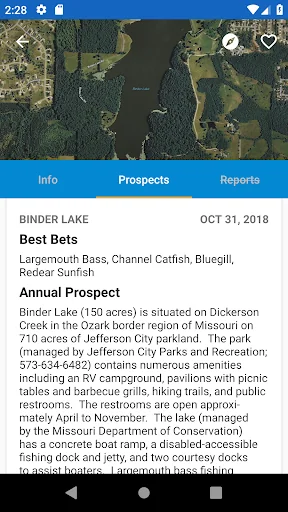
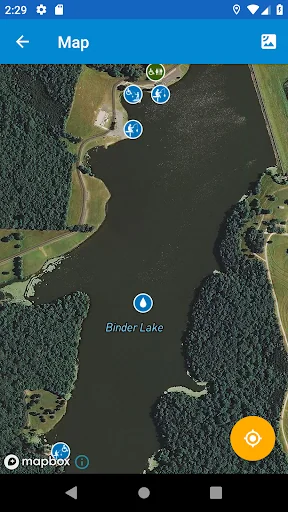
Live screenshots from the Play Store, captured by our snapshot worker. Tap any image to enlarge.

MO Fishing screenshot 1 MO Fishing screenshot 2 MO Fishing screenshot 3 MO Fishing screenshot 4

MO Fishing's revenue trajectory

Forecast revenue from snapshot history. Last 1 months.

Where MO Fishing sits in Travel & Local

Revenue distribution of 30046 comparable apps. MO Fishing highlighted.

MO Fishing vs comparable apps

Revenue trajectory side-by-side. Bold = MO Fishing, ghosted = peers.

App spec

Version
1.8.1
Last update
Apr 30, 2026
Launched
Jul 12, 2016
Price
Free
Monetization
Free

What MO Fishing actually does (from store listing)

MO Fishing helps you find the best places to fish in Missouri. Find nearby lakes, rivers, and streams, navigate to boat ramps or parking areas, and read annual and weekly fishing reports. You can also view the locations of state-provided fish attractors. A handy fish guide is also provided to help you identify your catch. Try it now and get hooked on fishing in Missouri!

Comparable Android apps

The five apps in Travel & Local with the closest revenue to MO Fishing. Click any to see its detail page.

AppRevenueRatingRatings
Bayern in historischen Karten icon Bayern in historischen Karten 304 ★ 4.5 238
Greatest Places on Earth DEMO icon Greatest Places on Earth DEMO 304 ★ 4.5 166
TmKontakt telefon sprawoçnik icon TmKontakt telefon sprawoçnik 304 ★ 4.7 809
Vijay Travels icon Vijay Travels 304 0
SBB FreeSurf icon SBB FreeSurf 304 ★ 1.1 863
Own MO Fishing? Replace our estimate with your real revenue via Stripe Connect or ASC. Get a public Verified badge.
Claim & verify →

How we calculated this

Each forecast combines App Store rating, ratings count, monetisation model, pricing tier, IAP signals and ad-supported flag. The base estimate is then multiplied by a per-category scaling factor learned from apps with founder-verified MRR. Every number on this page comes from public APIs and bumetric's own snapshot history.

Full methodology covers input variables, accuracy bands per category and how we treat apps without comparable anchors. See also the live data on MO Fishing's tracker page for current rating, reviews and snapshot timeline.

Building something similar? Get a free AI audit with $-revenue forecasts for every recommendation.
Audit my app →