What MOLSLINJEN actually does (from store listing)
Welcome to your new and improved MOLSLINJEN app!
Update:
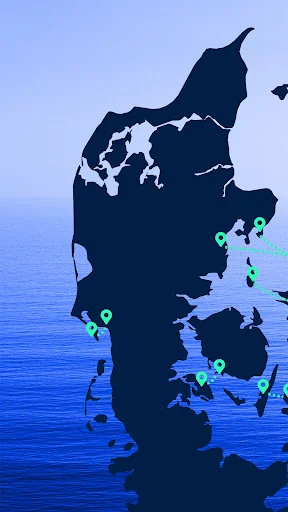
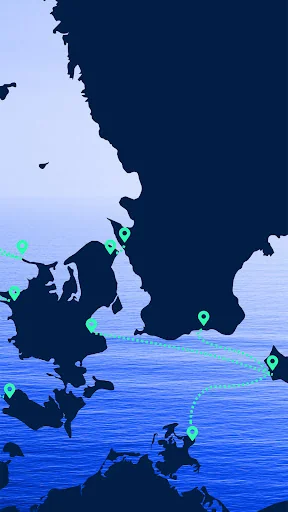
The biggest change you will notice is our beautiful new redesign. In addition, we have added ØRESUNDSLINJEN, which is our new route between Helsingør and Helsingborg.
You can still do everything that you’re used to doing in the MOLSLINJEN app. The app’s many features are listed below.
In the MOLSLINJEN app, you can:
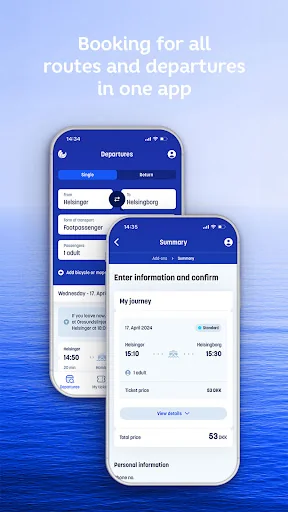
• see the timetable and book tickets for all our routes: MOLSLINJEN, BORNHOLMSLINJEN, ALSLINJEN, LANGELANDSLINJEN…
Update:
The biggest change you will notice is our beautiful new redesign. In addition, we have added ØRESUNDSLINJEN, which is our new route between Helsingør and Helsingborg.
You can still do everything that you’re used to doing in the MOLSLINJEN app. The app’s many features are listed below.
In the MOLSLINJEN app, you can:
• see the timetable and book tickets for all our routes: MOLSLINJEN, BORNHOLMSLINJEN, ALSLINJEN, LANGELANDSLINJEN, SAMSØLINJEN, FANØLINJEN and ØRESUNDSLINJEN.
• create a profile and add, for example, travelling companions, vehicles and payment cards.
• see a complete overview of your tickets.
• add trip card and commuter agreement.
• skip the queue and pre-order food and drinks for MOLSLINJEN on the Aarhus-Odden route.
• see your expected driving time to selected ferry ports.
• change your ticket if you are unable to make your original departure.
• receive automatic notifications via the app if changes are made to any relevant departures.
• add tickets you have purchased on the MOLSLINJEN, BORNHOLMSLINJEN, ALSLINJEN, LANGELANDSLINJEN, SAMSØLINJEN, FANØLINJEN and ØRESUNDSLINJEN websites so you have them with you on the go.
• it is not possible to book tickets for pensioners and disabled passengers in our app. This can be done on our website.
The app will continually be updated with new features.
We look forward to welcoming you on board – both on the ferries and in the new app.
Kombardo!
Please note: This Android app requires min. software version 7.
Comparable Android apps
The five apps in Travel & Local with the closest revenue to MOLSLINJEN. Click any to see its detail page.
Each forecast combines App Store rating, ratings count, monetisation model, pricing tier, IAP signals and ad-supported flag.
The base estimate is then multiplied by a per-category scaling factor learned from apps with founder-verified MRR.
Every number on this page comes from public APIs and bumetric's own snapshot history.
Full methodology covers input variables, accuracy bands per category and how we treat apps without comparable anchors.
See also the live data on MOLSLINJEN's tracker page for current rating, reviews and snapshot timeline.
Building something similar? Get a free AI audit with $-revenue forecasts for every recommendation.

 Hub – taxi cheap
 Bookingcar - car rental
 TIM Turismo
 Camping 3in1
 GOAMILES DRIVER