What Move to iOS actually does (from store listing)
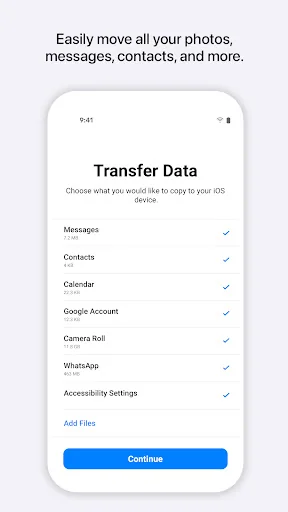
Everything about iOS is designed to be easy. That includes switching to it. With just a few steps, you can migrate your content automatically and securely from your Android device with the Move to iOS app. No need to save your stuff elsewhere before switching from Android. The Move to iOS app securely transfers all kinds of content data for you:
Apps
Calendars
Call logs
Contacts
Camera photos and videos
Mail accounts
Message history
Voice memos
WhatsApp content
Make sure to keep yo…
Everything about iOS is designed to be easy. That includes switching to it. With just a few steps, you can migrate your content automatically and securely from your Android device with the Move to iOS app. No need to save your stuff elsewhere before switching from Android. The Move to iOS app securely transfers all kinds of content data for you:
Apps
Calendars
Call logs
Contacts
Camera photos and videos
Mail accounts
Message history
Voice memos
WhatsApp content
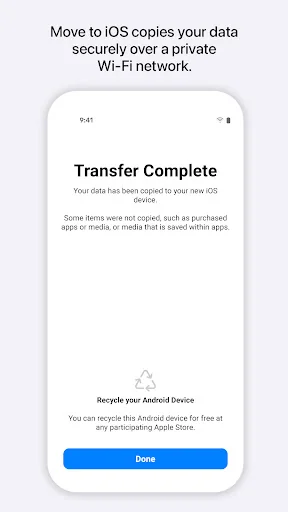
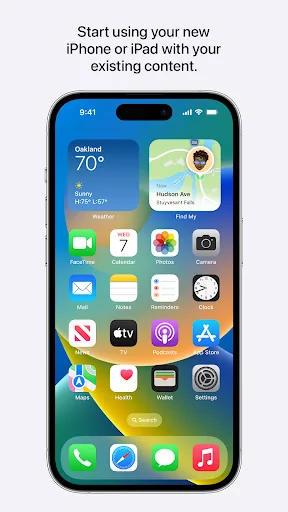
Make sure to keep your devices nearby and connected to power until the transfer is complete. When you choose to migrate your data, your new iPhone or iPad will create a private Wi-Fi network and find your nearby Android device running Move to iOS. After you enter a security code, it will begin transferring your content and put it in the right places. Just like that. Once your content has been transferred, you’re ready to get going. That’s it — you can start using your new iPhone or iPad and experiencing its endless possibilities. Enjoy.
Required App Permission
Location: To establish a Wi-Fi connection between the Android device and the iPhone or iPad, which is needed to migrate the data.
Optional App Permission
- SMS: To migrate your text messages, including multi-media messages and group chats, on iPhone or iPad.
- Photos and Videos: To migrate your photos, videos, and related metadata to iPhone or iPad.
- Notifications: To allow local Android notifications about the status of your migration to iPhone or iPad.
- Contacts: To migrate your contacts to iPhone or iPad.
- Music and Audio: To migrate your downloaded media, audio recordings, and voice memos to iPhone or iPad.
- Phone: To migrate your SIM and carrier information so you can make and manage phone calls on iPhone or iPad.
- Calendar: To migrate your calendar events to iPhone or iPad.
- Call Logs: To migrate your call history to iPhone or iPad.
You can use Move to iOS even without providing consent to any of the above optional app permissions. However, some features of the service may not be available.
Comparable Android apps
The five apps in Tools with the closest revenue to Move to iOS. Click any to see its detail page.
Each forecast combines App Store rating, ratings count, monetisation model, pricing tier, IAP signals and ad-supported flag.
The base estimate is then multiplied by a per-category scaling factor learned from apps with founder-verified MRR.
Every number on this page comes from public APIs and bumetric's own snapshot history.
Full methodology covers input variables, accuracy bands per category and how we treat apps without comparable anchors.
See also the live data on Move to iOS's tracker page for current rating, reviews and snapshot timeline.
Building something similar? Get a free AI audit with $-revenue forecasts for every recommendation.

 Neon Signs Pro
 DO Multiple Accounts & Clone
 Integrated Timer
 Metronet
 Termux