ML revenue forecast.
Calibrated against 77129 apps in this category.
Confidence band
±15%
High — many comparable apps with verified data
At a glance
Earns 13.62× more than the category median (189/mo).
Ranks #1,841 of 77,129 in Tools (top 2.4% by revenue).
Launched Oct 05, 2013 · last updated Oct 10, 2025.
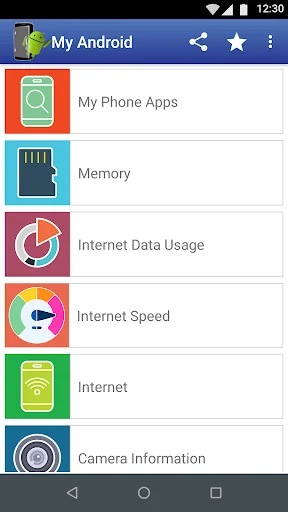
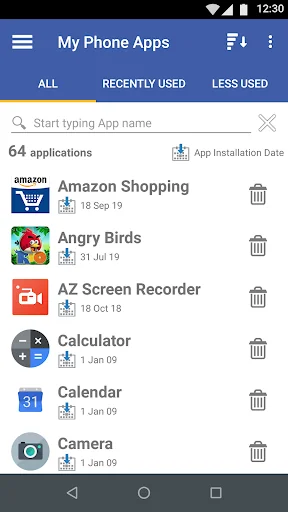
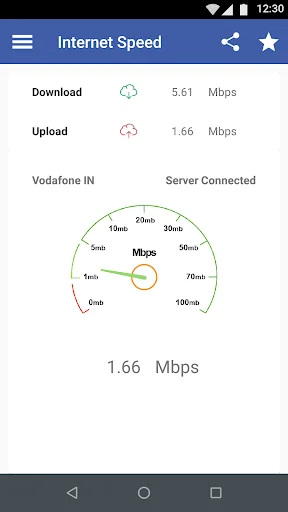
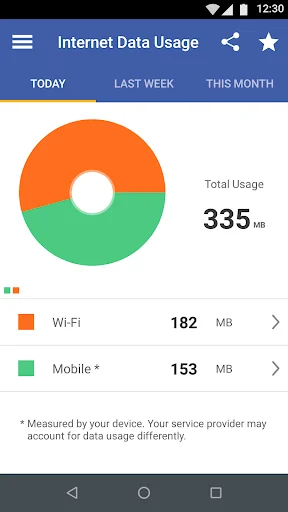
What the app looks like
Live screenshots from the Play Store, captured by our snapshot worker. Tap any image to enlarge.
My Android's revenue trajectory
Forecast revenue from snapshot history. Last 2 months.
Where My Android sits in Tools
Revenue distribution of 77129 comparable apps. My Android highlighted.
My Android vs comparable apps
Revenue trajectory side-by-side. Bold = My Android, ghosted = peers.
App spec
Version
11.3.0
Last update
Oct 10, 2025
Launched
Oct 05, 2013
Price
Free
Monetization
Free
What My Android actually does (from store listing)
My Android app will help you to know the following:
1. A list & count of applications installed on your phone.
2. Memory available for both Phone and SD card.
3. Internet data usage feature to monitor data usage for mobile and Wi-Fi network.
4. Internet Speed feature to test internet provider’s speed
5. Internet connection your device is connected to.
6. Megapixel of back and front cameras & the number of photos that can be clicked from the camera based on megapixel of your camera and re…
My Android app will help you to know the following:
1. A list & count of applications installed on your phone.
2. Memory available for both Phone and SD card.
3. Internet data usage feature to monitor data usage for mobile and Wi-Fi network.
4. Internet Speed feature to test internet provider’s speed
5. Internet connection your device is connected to.
6. Megapixel of back and front cameras & the number of photos that can be clicked from the camera based on megapixel of your camera and remaining memory on your phone.
7. How to take screenshot (picture of the current screen) on your phone.
8. Size & resolution of screen in pixels and inches.
9. Screen density of your phone.
10. RAM of the device.
11. Android version name & number.
12. Manufacturer and Model number of the device.
13. Get tips on using your Android phone effectively.
Comparable Android apps
The five apps in Tools with the closest revenue to My Android. Click any to see its detail page.
Each forecast combines App Store rating, ratings count, monetisation model, pricing tier, IAP signals and ad-supported flag.
The base estimate is then multiplied by a per-category scaling factor learned from apps with founder-verified MRR.
Every number on this page comes from public APIs and bumetric's own snapshot history.
Full methodology covers input variables, accuracy bands per category and how we treat apps without comparable anchors.
See also the live data on My Android's tracker page for current rating, reviews and snapshot timeline.
Building something similar? Get a free AI audit with $-revenue forecasts for every recommendation.

 Rocklogger Unlocker
 SmarterNoise Plus
 Chinese Lunar Calendar Full
 Magnifier 4U Pro
 WiFi App: passwords, hotspots