What my-benefits actually does (from store listing)
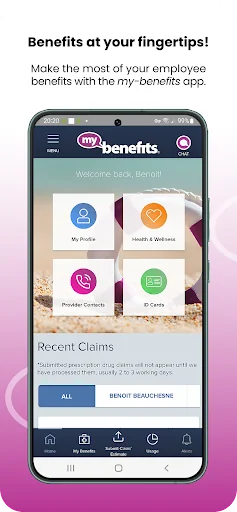
Easily access your employee benefits online with the my-benefits app.
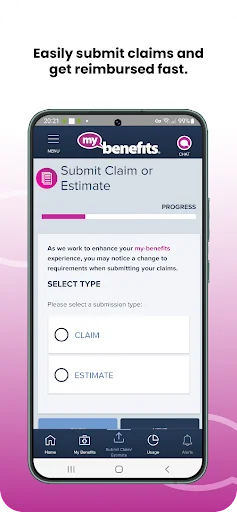
• Submit paperless claims for you and your dependents directly from your smartphone or tablet.
• Set up direct deposit for faster reimbursement.
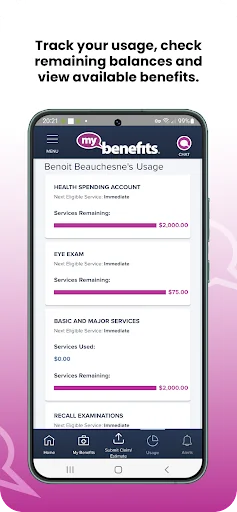
• Track your benefits usage and spending account balances.
• View coverage details and know when you’re next eligible for services.
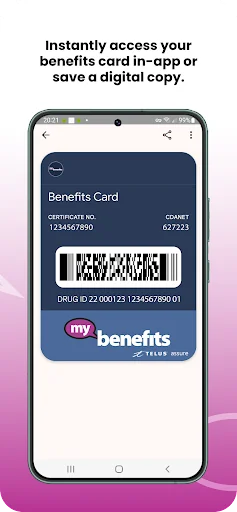
• Access your benefits card and save a digital copy to your virtual wallet.
• Connect to the virtual medical services and wellness resources incl…
Easily access your employee benefits online with the my-benefits app.
• Submit paperless claims for you and your dependents directly from your smartphone or tablet.
• Set up direct deposit for faster reimbursement.
• Track your benefits usage and spending account balances.
• View coverage details and know when you’re next eligible for services.
• Access your benefits card and save a digital copy to your virtual wallet.
• Connect to the virtual medical services and wellness resources included in your plan.
• Access Personal Benefits to add coverage where and when you need it, including unique travel insurance options, Critical Illness insurance, and more, all in the same app.
Make the most of your employee benefits plan today.
my-benefits is exclusive to individuals covered by group plans administered by Johnston Group Inc.
Comparable Android apps
The five apps in Finance with the closest revenue to my-benefits. Click any to see its detail page.
Each forecast combines App Store rating, ratings count, monetisation model, pricing tier, IAP signals and ad-supported flag.
The base estimate is then multiplied by a per-category scaling factor learned from apps with founder-verified MRR.
Every number on this page comes from public APIs and bumetric's own snapshot history.
Full methodology covers input variables, accuracy bands per category and how we treat apps without comparable anchors.
See also the live data on my-benefits's tracker page for current rating, reviews and snapshot timeline.
Building something similar? Get a free AI audit with $-revenue forecasts for every recommendation.

 BKS Security
 Skandia Colombia APP
 MySwan
 Commodity Live
 SNB Mobile Banking