<b>The NEW cross-platform version of My Collections.</b>
With 'My Collections' you can create customisable content of your favourite collections.
See this web page for detailed help on <u><a href="https://www.google.com/url?q=https%3A%2F%2Fwww.softwyer.com%2Fcollections-applications%2Fsetting-up-your-collection&sa=D&sntz=1&usg=AOvVaw0OQ8f1ETtIhQDepRv9CWwf">setting up your collection</a></u>
View and edit your collections <u><a href="https://softwyer-collections.web.app/">on the web</a><…
The NEW cross-platform version of My Collections.
With 'My Collections' you can create customisable content of your favourite collections.
See this web page for detailed help on
setting up your collection
View and edit your collections
on the web
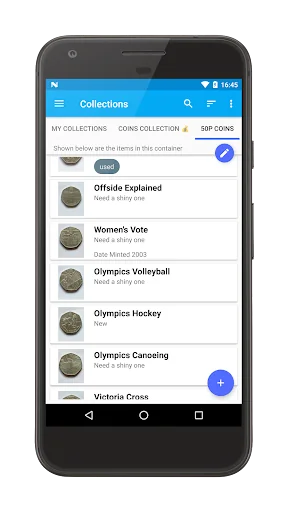
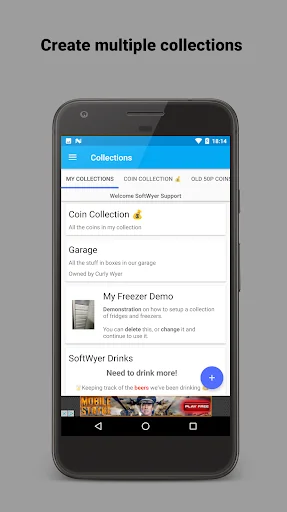
* Create collections with any level of containers (e.g. coin value, stamp country) and items (e.g. coins, stamps, bottle tops)
* Invite other users to share your collection. They initially have read access only but you can selectively give write access.
* Items have default name and description fields.
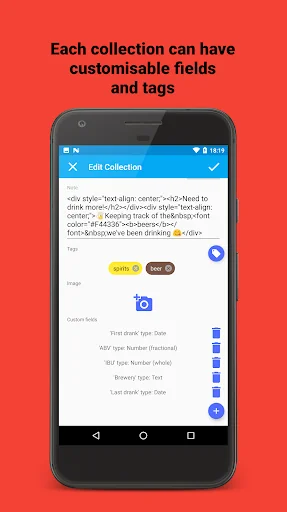
* Custom Fields in Collections with String, Date or Number types. Custom Fields can be mandatory, optionally shown in the lists and are searchable.
* Custom Fields also have custom formatting so you can display the values however you like.
* Custom Fields can capture image text and barcodes
* Sort items by any field, including custom ones.
* Add tags to items and filter by tag when searching.
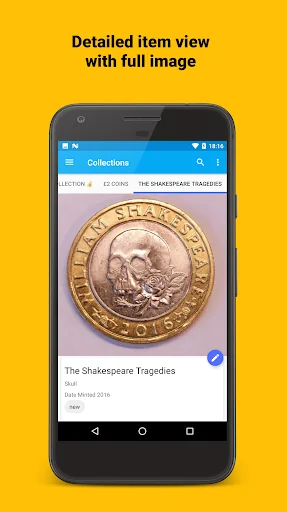
* Items can have pictures either from the camera direct or via your photos collection.
* Drag and drop ordering of items in a container (use 'User defined' sort mode)
* Show and print a list of items that are needed to restock a collection - use this for a list of 'wanted' items
* Search across all items in a collection.
* Print a list of all the items in the search
* Backup your collections
* Restore your collections (paid subscription required)
* Import CSV files into a collection (paid subscription required)
* Cloud based storage so it syncs automagically across your devices.
* Manage users and give them READ, WRITE or ADMIN roles to your collection.
* View public collections that other users have shared
* Receive notifications when an item is updated in a collection you are watching
* Product scanning by EAN/UPC. It's a bit hit and miss relying on UPCItemDB to get details.
* Images loaded from the web if they are detailed in the scan metadata.
If you would like a new feature to be added, or have found a bug, just email support@softwyer.com and we'll be happy to help you


 Nuvola
 아르바이트 다이어리
 TYG APP
 Iristrace
 Apna Godam