ML revenue forecast.
Calibrated against 2499 apps in this category.
Confidence band
±15%
High — many comparable apps with verified data
At a glance
Earns 7.96× more than the category median (875/mo).
Ranks #145 of 2,499 in Travel (top 5.8% by revenue).
Launched Aug 02, 2012 · last updated May 19, 2026.
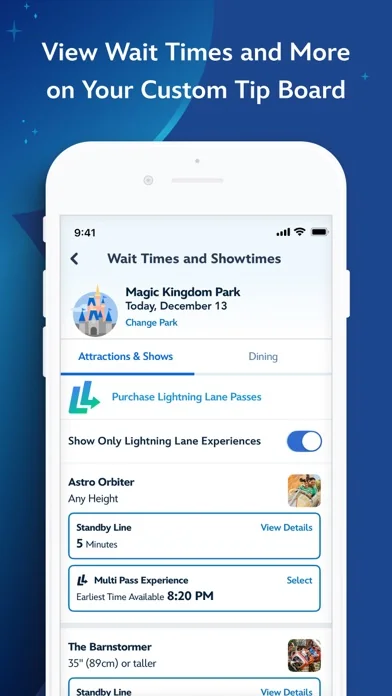
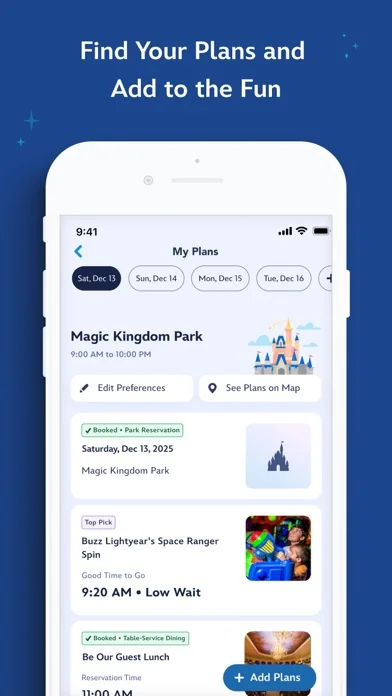
What the app looks like
Live screenshots from the App Store, captured by our snapshot worker. Tap any image to enlarge.
My Disney Experience's revenue trajectory
Forecast revenue from snapshot history. Last 3 months.
Where My Disney Experience sits in Travel
Revenue distribution of 2499 comparable apps. My Disney Experience highlighted.
My Disney Experience vs comparable apps
Revenue trajectory side-by-side. Bold = My Disney Experience, ghosted = peers.
App spec
Version
8.21.1
Last update
May 19, 2026
Launched
Aug 02, 2012
Min OS
17.0
Rating
4+
Price
Free
Monetization
Freemium
Languages
EN
What My Disney Experience actually does (from App Store listing)
The official Walt Disney World® app! Now it’s easier than ever to plan & share your vacation details—at home & on the go.
-Maximize your park time by taking advantage of our new Disney Genie service, which generates a personalized itinerary that guides you through our theme parks with tips that can help you reduce time in lines & take the guesswork out of “what’s next.”
-Quickly access real-time wait times, park hours, Character Greetings, showtimes & more.
-Use the interactive, GPS-enabled map …
The official Walt Disney World® app! Now it’s easier than ever to plan & share your vacation details—at home & on the go. -Maximize your park time by taking advantage of our new Disney Genie service, which generates a personalized itinerary that guides you through our theme parks with tips that can help you reduce time in lines & take the guesswork out of “what’s next.” -Quickly access real-time wait times, park hours, Character Greetings, showtimes & more. -Use the interactive, GPS-enabled map to explore the Resort & easily see the dining options, attractions & more nearest to you. -Find your way around with step-by-step directions. -Browse restaurant menus, make dining reservations, modify existing ones & even mobile order meals from select locations. -Download, edit & share your Disney PhotoPass® photos & videos throughout your vacation once you’ve purchased Memory Maker. -Search & filter activities to find exactly what you’re looking for. -Keep select Disney Resort hotel reservations, dining plans & activities organized—all in one spot with My Day & Plans. -Save time by starting your Disney Resort hotel check-in process right from the app. -Link a MagicBand+ to your Disney account on the app & unlock enchanting touches of magic. -Save your parking information at select parking locations with car locator. -Manage your Disney Resort reservations, tickets, MagicBands & cards & share plans with others. -Discover official content for Walt Disney World Resort, including our 4 theme parks (Magic Kingdom® park, Epcot®, Disney’s Hollywood Studios® & Disney’s Animal Kingdom® park), 2 water parks (Disney’s Typhoon Lagoon & Disney’s Blizzard Beach water parks), Disney Springs®, select Walt Disney World Resort hotels & ESPN Wide World of Sports Complex. Have questions, problems, comments or suggestions? Reach out to us at app.support@disneyworld.com. Connecting to the Internet in the parks: Without a strong Internet signal, wait times, park hours & schedules may not update accurately. You can see if your device is connected properly by checking under Settings. Note: Some features in this app will require your full name, country, birthdate & email address, as well as access to your location data. If Bluetooth is enabled on your device, this app will also collect your precise location information through beacon technology in order to improve your in-park experience, such as wait times. To facilitate the sign-in process, the app will also require access to your email address, stored within Account Manager. This app may request access to your camera to capture media & scan barcodes. Some Disney PhotoPass Lenses may use information on your device to detect face & hand coordinates. The app may request access to your external storage to cache certain data for offline browsing. Optional planning tools may also ask you to provide details about your travel party. Some features in this app include the ability to make purchases & will require a Wi-Fi or mobile carrier data connection. Message, data and roaming rates may apply. Availability subject to handset limitations and features may vary by handset or service provider. Coverage and app stores not available everywhere. Guests must be 18 years or older to make purchases. Before downloading, please consider that this app contains in-app purchases that cost real money. The app provides you with the option to receive push notifications for information relating to your visit to a Park or a Disney Resort hotel. Terms of Use: http://disneytermsofuse.com Privacy Policy: https://disneyprivacycenter.com Your US State Privacy Rights: https://privacy.thewaltdisneycompany.com/en/current-privacy-policy/your-us-state-privacy-rights/ Do Not Sell or Share My Personal Information: https://privacy.twdc.com/dnssmpi Important Info About Disney PhotoPass Lenses: https://disneyworld.disney.go.com/photopass-terms-conditions/#important-notice-about-attribute-lenses
🆕 What's new · v8.21.1
We’ve added new details about events, entertainment and more—to help you plan your Walt Disney World Resort visit. Plus, we’ve improved overall app performance.
Comparable iOS apps
The five apps in Travel with the closest revenue to My Disney Experience. Click any to see its detail page.
Each forecast combines App Store rating, ratings count, monetisation model, pricing tier, IAP signals and ad-supported flag.
The base estimate is then multiplied by a per-category scaling factor learned from apps with founder-verified MRR.
Every number on this page comes from public APIs and bumetric's own snapshot history.
Full methodology covers input variables, accuracy bands per category and how we treat apps without comparable anchors.
See also the live data on My Disney Experience's tracker page for current rating, reviews and snapshot timeline.
Building something similar? Get a free AI audit with $-revenue forecasts for every recommendation.

 Offbeat Attractions
 GroomerTracker
 SeaPeople: Boot Tracker
 Next Bus Times London
 Revealed Travel Guides