Android app
from The City of Calgary
· Travel & Local
ML forecast★ 2.9 · 791Free
~246/mo
ML revenue forecast.
Calibrated against 30046 apps in this category.
Confidence band
±15%
High — many comparable apps with verified data
At a glance
Earns 1.58× more than the category median (155/mo).
Ranks #7,141 of 30,046 in Travel & Local (top 23.8% by revenue).
Launched Jun 30, 2020 · last updated Dec 24, 2025.
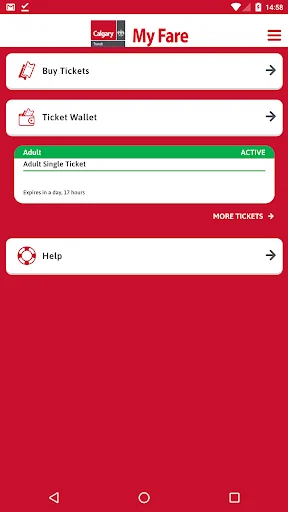
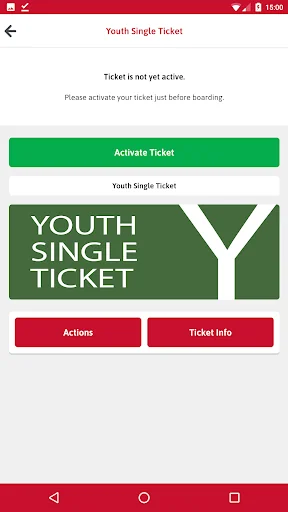
What the app looks like
Live screenshots from the Play Store, captured by our snapshot worker. Tap any image to enlarge.
My Fare's revenue trajectory
Forecast revenue from snapshot history. Last 1 months.
Where My Fare sits in Travel & Local
Revenue distribution of 30046 comparable apps. My Fare highlighted.
My Fare vs comparable apps
Revenue trajectory side-by-side. Bold = My Fare, ghosted = peers.
App spec
Version
7.9.2
Last update
Dec 24, 2025
Launched
Jun 30, 2020
Price
Free
Monetization
Free
What My Fare actually does (from store listing)
Purchase and use tickets instantly on your smartphone. Your tickets/passes are stored directly on your phone and can be activated whenever you're ready to begin your trip.
With Calgary Transit My Fare you can:
- Conveniently purchase your ticket or pass online before you travel, using your credit or debit card
- Activate your ticket/pass
- Pay a single fare or multiple fares for a group of riders
- Store multiple tickets on your phone for future use
- Stop using paper tickets - your smar…
Purchase and use tickets instantly on your smartphone. Your tickets/passes are stored directly on your phone and can be activated whenever you're ready to begin your trip.
With Calgary Transit My Fare you can:
- Conveniently purchase your ticket or pass online before you travel, using your credit or debit card
- Activate your ticket/pass
- Pay a single fare or multiple fares for a group of riders
- Store multiple tickets on your phone for future use
- Stop using paper tickets - your smartphone is your ticket
Comparable Android apps
The five apps in Travel & Local with the closest revenue to My Fare. Click any to see its detail page.
Each forecast combines App Store rating, ratings count, monetisation model, pricing tier, IAP signals and ad-supported flag.
The base estimate is then multiplied by a per-category scaling factor learned from apps with founder-verified MRR.
Every number on this page comes from public APIs and bumetric's own snapshot history.
Full methodology covers input variables, accuracy bands per category and how we treat apps without comparable anchors.
See also the live data on My Fare's tracker page for current rating, reviews and snapshot timeline.
Building something similar? Get a free AI audit with $-revenue forecasts for every recommendation.

 RailMe (PATCO, SEPTA, NJT)
 長岡花火 公式アプリ
 Hoyer
Hoyer
 MSC 360VR
 About Delhi