ML revenue forecast.
Calibrated against 48160 apps in this category.
Confidence band
±15%
High — many comparable apps with verified data
At a glance
Earns 2.06× more than the category median (130/mo).
Ranks #5,799 of 48,160 in Business (top 12.0% by revenue).
Launched Jan 15, 2015.
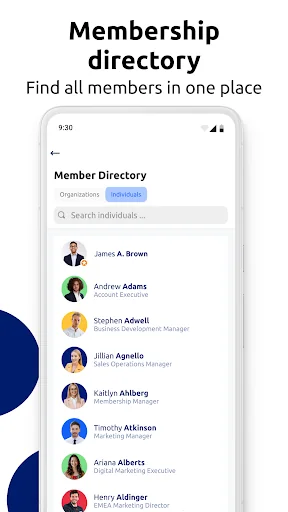
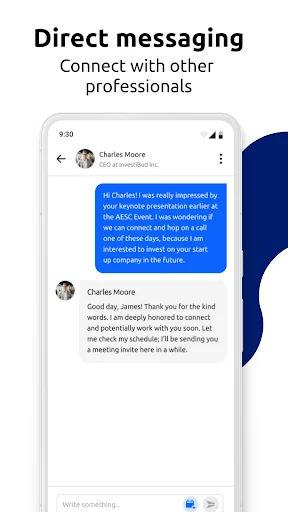
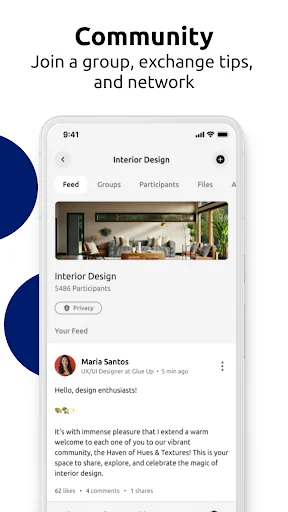
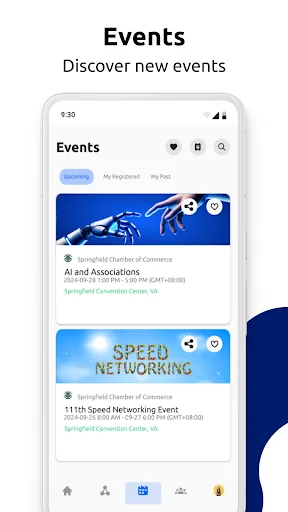
What the app looks like
Live screenshots from the Play Store, captured by our snapshot worker. Tap any image to enlarge.
My Glue's revenue trajectory
Forecast revenue from snapshot history. Last 1 months.
Where My Glue sits in Business
Revenue distribution of 48160 comparable apps. My Glue highlighted.
My Glue vs comparable apps
Revenue trajectory side-by-side. Bold = My Glue, ghosted = peers.
App spec
Version
Varies with device
Launched
Jan 15, 2015
Price
Free
Monetization
Free
What My Glue actually does (from store listing)
My Glue app gives you a new way to engage, network and receive important information about your events, memberships and more even when meeting in person is not possible. Get the most out of your events and maximize your membership benefits with an all-in-one engagement app.
Key Community Enagement Features:
* Direct messaging
* Group chats & event rooms
* Digital busineess cards
* Personal CRM for all connections you make
* Contact profile
Key Event Features:
* Fast event r…
My Glue app gives you a new way to engage, network and receive important information about your events, memberships and more even when meeting in person is not possible. Get the most out of your events and maximize your membership benefits with an all-in-one engagement app.
Key Community Enagement Features:
* Direct messaging
* Group chats & event rooms
* Digital busineess cards
* Personal CRM for all connections you make
* Contact profile
Key Event Features:
* Fast event registration and payment processing
* Easy check-in with QR codes
* Quick access to all event information including agendas, venues, speaker bios, session presentations, and ticketing
* Preview and register for upcoming events that match your interests
* Social media integration for easy sharing
Key Membership Features:
* Direct access to organization newsletters, announcements, and upcoming events
* Mobile membership directories so you can expand your network
* Member profile and membership renewal management
* Virtual membership cards to leverage all your membership benefits
About Glue Up
Formerly EventBank, Glue Up is the leading provider of the cloud solutions that provide associations, event organizers, Chambers of Commerce, agencies, marketers, businesses, and NGOs with a full suite of tools designed to streamline operations, modernize processes, and eliminate engagement challenges. Glue Up’s innovative all-in-one CRM platform that helps you build and grow your community through events, memberships & other digital tools. Glue Up is currently present in 50+ countries around the world with customers ranging from local Chambers of Commerce like Queens Chamber of Commerce or Tempe Chamber of Commerce to international Chambers like American Chamber of Commerce in Poland or Hong Kong, Associations, through to community organizations and Fortune 500 customers like KPMG and Moody’s.
The My Glue app is a free mobile app for event attendees and members of Glue Up customers.
Comparable Android apps
The five apps in Business with the closest revenue to My Glue. Click any to see its detail page.
Each forecast combines App Store rating, ratings count, monetisation model, pricing tier, IAP signals and ad-supported flag.
The base estimate is then multiplied by a per-category scaling factor learned from apps with founder-verified MRR.
Every number on this page comes from public APIs and bumetric's own snapshot history.
Full methodology covers input variables, accuracy bands per category and how we treat apps without comparable anchors.
See also the live data on My Glue's tracker page for current rating, reviews and snapshot timeline.
Building something similar? Get a free AI audit with $-revenue forecasts for every recommendation.
 Autorox - Garage Management
 Max Energy Galaxy Club
 SKF Authenticate
 Vodafone NPS
 QMR - Quick Market Reports