ML revenue forecast.
Calibrated against 77129 apps in this category.
Confidence band
±15%
High — many comparable apps with verified data
At a glance
Earns 1.65× more than the category median (189/mo).
Ranks #20,489 of 77,129 in Tools (top 26.6% by revenue).
Launched Nov 24, 2020 · last updated Apr 23, 2026.
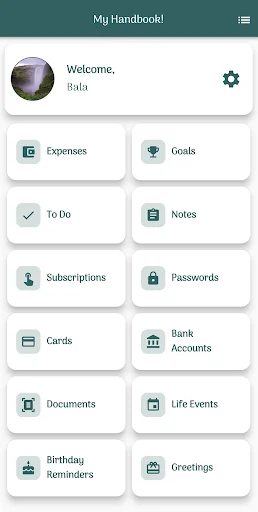
What the app looks like
Live screenshots from the Play Store, captured by our snapshot worker. Tap any image to enlarge.
My Handbook!'s revenue trajectory
Forecast revenue from snapshot history. Last 1 months.
Where My Handbook! sits in Tools
Revenue distribution of 77129 comparable apps. My Handbook! highlighted.
My Handbook! vs comparable apps
Revenue trajectory side-by-side. Bold = My Handbook!, ghosted = peers.
App spec
Version
4.2.9
Last update
Apr 23, 2026
Launched
Nov 24, 2020
Price
Free
Monetization
Free
What My Handbook! actually does (from store listing)
MY EXPENSES:
> Lets you manage all the Expenses.
> Each Expense added can be categorized using the Category provided.
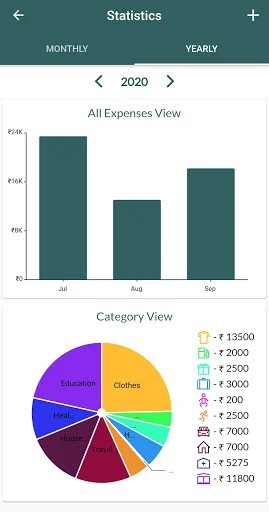
> Options to view the total expenses in Daily, Monthly, and Yearly options.
> Statistics Page is available to view the Graphic Chart of the expenses.
GOALS:
> Lets you to plan your goals holistically.
> Helps you to plan you goals in minutes for absolutely free.
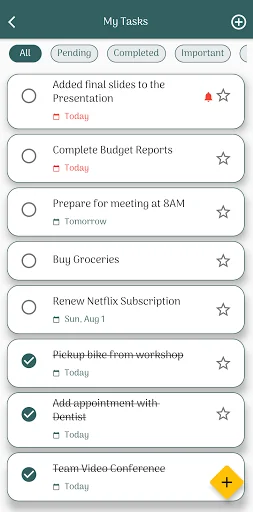
TO-DO:
> Lets you add and edit all the Tasks.
> Able to set Reminders Date & Time, App will notify at…
MY EXPENSES:
> Lets you manage all the Expenses.
> Each Expense added can be categorized using the Category provided.
> Options to view the total expenses in Daily, Monthly, and Yearly options.
> Statistics Page is available to view the Graphic Chart of the expenses.
GOALS:
> Lets you to plan your goals holistically.
> Helps you to plan you goals in minutes for absolutely free.
TO-DO:
> Lets you add and edit all the Tasks.
> Able to set Reminders Date & Time, App will notify at that time.
> Able to set Due Dates, Will displaying those tasks in Planned Tab.
> Able to mark tasks as Important, Will display those tasks in Important Tab.
NOTES:
> Lets you to take notes at anytime and wherever you go.
> Offline notepad that you can use to write on all the notes to remember without the need for internet connection.
> Take Notes and Achieve More.
> Save ideas at the speed of light.
DOCUMENTS:
> Lets you to add files and access it wherever you go.
> It's completely offline, that you can use to add and remove files without the need of internet connection.
SUBSCRIPTIONS:
> Lets you add all the Subscriptions.
> Can add Next Billing date, App will notify days before the Bill date as selected.
PASSWORDS:
> Lets you save all the Login Usernames/Email IDs.
> Can save the Password for the Login Details - So that you don't have to remember the passwords for different logins.
CARDS & BANK ACCOUNTS:
> Lets you add all the Bank Account Details & Cards Details.
> Can save PINs and other details. (Data added in the app will only be saved to your device, No data is collected)
MY LIFE EVENTS:
> Lets you add your Memorable Life Events.
> Can add location of Events.
> Able to view the Event in Calendar.
BIRTHDAY REMINDERS:
> Lets you add Birthdays of Friends & Family.
> Will Remind the special day based on the preferred setting.
GREETINGS:
> Lets you create your own Greeting Cards.
> Default Templates are available for the Cards.
> Able to add Custom Text in your Cards.
SPECIAL FEATURES:
> Can set Fingerprint Authorization for the safety of your data, App will prompt every time opening the app.
> Dark Mode Settings Available.
We're always excited to hear from you! If you have any feedback, questions, or concerns, please email us at myhandbook.feedback@gmail.com.
Comparable Android apps
The five apps in Tools with the closest revenue to My Handbook!. Click any to see its detail page.
Each forecast combines App Store rating, ratings count, monetisation model, pricing tier, IAP signals and ad-supported flag.
The base estimate is then multiplied by a per-category scaling factor learned from apps with founder-verified MRR.
Every number on this page comes from public APIs and bumetric's own snapshot history.
Full methodology covers input variables, accuracy bands per category and how we treat apps without comparable anchors.
See also the live data on My Handbook!'s tracker page for current rating, reviews and snapshot timeline.
Building something similar? Get a free AI audit with $-revenue forecasts for every recommendation.


 Prefectura
 Dynex TV Remote
 Square Cube Root Calculator
 Easy Open Link
 XG Scale