ML revenue forecast.
Calibrated against 77129 apps in this category.
Confidence band
±15%
High — many comparable apps with verified data
At a glance
Earns 10.49× more than the category median (189/mo).
Ranks #3,056 of 77,129 in Tools (top 4.0% by revenue).
Launched Mar 19, 2015 · last updated Jul 07, 2026.
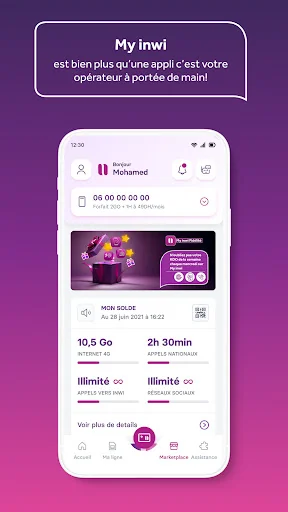
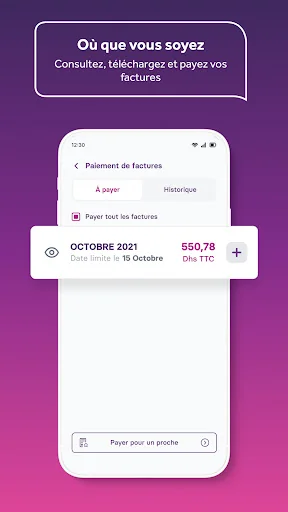
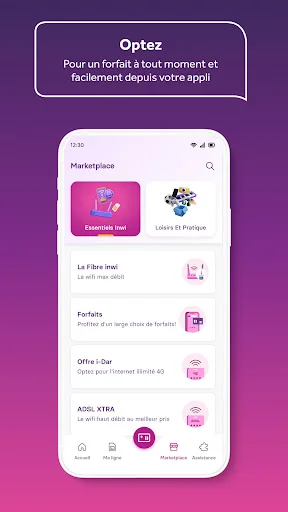
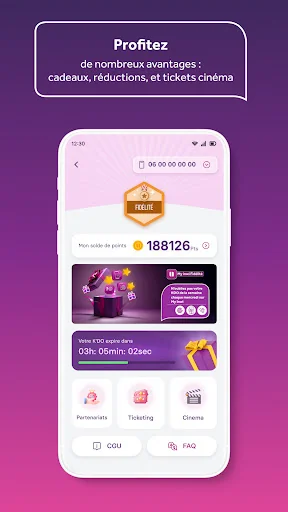
What the app looks like
Live screenshots from the Play Store, captured by our snapshot worker. Tap any image to enlarge.
My inwi's revenue trajectory
Forecast revenue from snapshot history. Last 3 months.
Where My inwi sits in Tools
Revenue distribution of 77129 comparable apps. My inwi highlighted.
My inwi vs comparable apps
Revenue trajectory side-by-side. Bold = My inwi, ghosted = peers.
App spec
Version
3.30.1
Last update
Jul 07, 2026
Launched
Mar 19, 2015
Price
Free
Monetization
Free
What My inwi actually does (from store listing)
With the My inwi app, manage all your mobile and internet lines easily and independently.
✨ Big news: eSIM is here!
Choose your eSIM directly from the app and enjoy a catalog of generous top-up options tailored to all your needs. Activating your line is simple.
📈 Track your usage in real time and keep an eye on your call, text, and internet balance.
💳 Securely top up your line or a loved one's line with your bank card or top-up card and postpone your bill payment.
🚀 Choose a mobile …
With the My inwi app, manage all your mobile and internet lines easily and independently.
✨ Big news: eSIM is here!
Choose your eSIM directly from the app and enjoy a catalog of generous top-up options tailored to all your needs. Activating your line is simple.
📈 Track your usage in real time and keep an eye on your call, text, and internet balance.
💳 Securely top up your line or a loved one's line with your bank card or top-up card and postpone your bill payment.
🚀 Choose a mobile plan anytime from your app via the "My Line" section.
🧾 Pay your bills or those of a loved one and schedule payment reminders.
🌍 Activate your roaming in one click! Check rates by zone and country by activating the pass that suits you. 📲 Enjoy and subscribe to the inwi services of your choice in just a few clicks.
🎁 inwi has enhanced its loyalty program: My inwi Loyalty now rewards all inwi customers, whether they use mobile (top-ups or plans) or Wi-Fi (i-dar, ADSL Xtra, or Fiber), by offering loyalty points that can be redeemed for even more generous gifts.
🆘 Get help! My inwi lets you chat live with an inwi advisor, retrieve your PUK code, suspend your line if your phone is lost or stolen, initiate the SMS setting up your mobile internet, and access the contact form for information requests.
📣 The My inwi app does not use your internet balance while browsing and is available for free download on the Play Store.
Comparable Android apps
The five apps in Tools with the closest revenue to My inwi. Click any to see its detail page.
Each forecast combines App Store rating, ratings count, monetisation model, pricing tier, IAP signals and ad-supported flag.
The base estimate is then multiplied by a per-category scaling factor learned from apps with founder-verified MRR.
Every number on this page comes from public APIs and bumetric's own snapshot history.
Full methodology covers input variables, accuracy bands per category and how we treat apps without comparable anchors.
See also the live data on My inwi's tracker page for current rating, reviews and snapshot timeline.
Building something similar? Get a free AI audit with $-revenue forecasts for every recommendation.

 Microphone
 Gallery: Photo Album Organizer
 PC Keyboard WiFi/Bluetooth Pro
 Mhegas
 Recover Deleted All Photos