ML revenue forecast.
Calibrated against 48160 apps in this category.
Confidence band
±15%
High — many comparable apps with verified data
At a glance
Tracks close to the Android app category median (130/mo).
Ranks #35,588 of 48,160 in Business (top 73.9% by revenue).
Launched Nov 04, 2018 · last updated Apr 30, 2026.
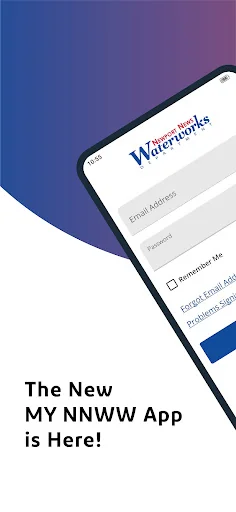
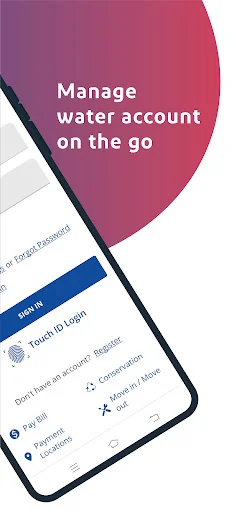
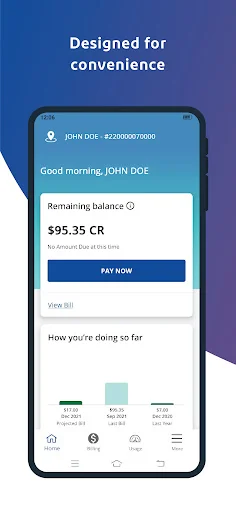
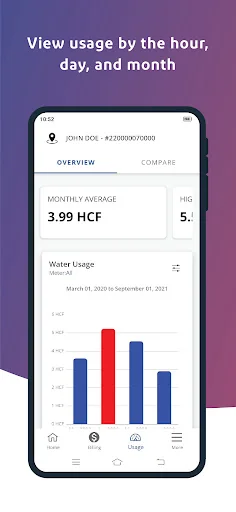
What the app looks like
Live screenshots from the Play Store, captured by our snapshot worker. Tap any image to enlarge.
My NNWW Water App's revenue trajectory
Forecast revenue from snapshot history. Last 1 months.
Where My NNWW Water App sits in Business
Revenue distribution of 48160 comparable apps. My NNWW Water App highlighted.
My NNWW Water App vs comparable apps
Revenue trajectory side-by-side. Bold = My NNWW Water App, ghosted = peers.
App spec
Version
2.6
Last update
Apr 30, 2026
Launched
Nov 04, 2018
Price
Free
Monetization
Free
What My NNWW Water App actually does (from store listing)
My NNWW Water App offers a convenient way to pay your water bill and view your usage with the new mobile application. It is aimed at enhancing the customer experience by offering a rich set of self-service functionalities.
Some key features include the following:
1) Manage the water account.
2) Monitor and compare water usage.
3) View and pay bills online with your preferred options.
4) Report for water outages & theft.
5) Multi-channel communication with the utility.
6) Get educationa…
My NNWW Water App offers a convenient way to pay your water bill and view your usage with the new mobile application. It is aimed at enhancing the customer experience by offering a rich set of self-service functionalities.
Some key features include the following:
1) Manage the water account.
2) Monitor and compare water usage.
3) View and pay bills online with your preferred options.
4) Report for water outages & theft.
5) Multi-channel communication with the utility.
6) Get educational & saving tips on water conservation.
Comparable Android apps
The five apps in Business with the closest revenue to My NNWW Water App. Click any to see its detail page.
Each forecast combines App Store rating, ratings count, monetisation model, pricing tier, IAP signals and ad-supported flag.
The base estimate is then multiplied by a per-category scaling factor learned from apps with founder-verified MRR.
Every number on this page comes from public APIs and bumetric's own snapshot history.
Full methodology covers input variables, accuracy bands per category and how we treat apps without comparable anchors.
See also the live data on My NNWW Water App's tracker page for current rating, reviews and snapshot timeline.
Building something similar? Get a free AI audit with $-revenue forecasts for every recommendation.

 Molazmat Employer
 Mahindra SSM
 Content Management Mobile
 Michelin Aircraft Tires
 Evergy Current - Employee News