ML revenue forecast.
Calibrated against 77129 apps in this category.
Confidence band
±15%
High — many comparable apps with verified data
At a glance
Earns 10.8× more than the category median (189/mo).
Ranks #2,460 of 77,129 in Tools (top 3.2% by revenue).
Launched Jul 21, 2016 · last updated May 07, 2026.
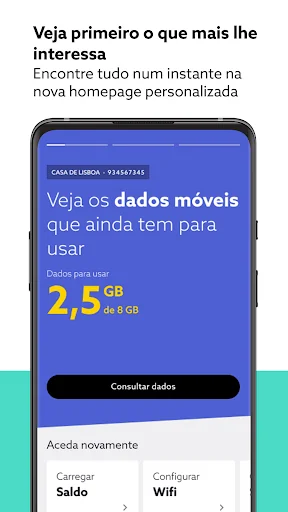
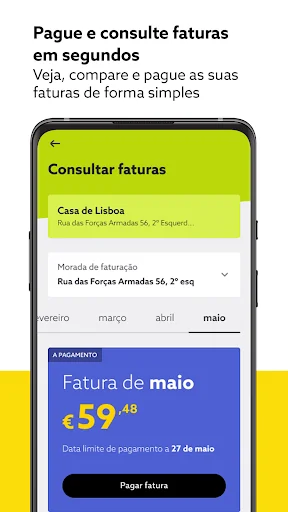
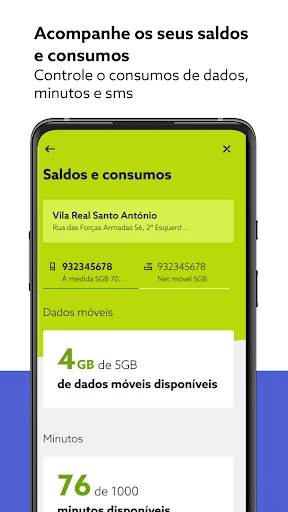
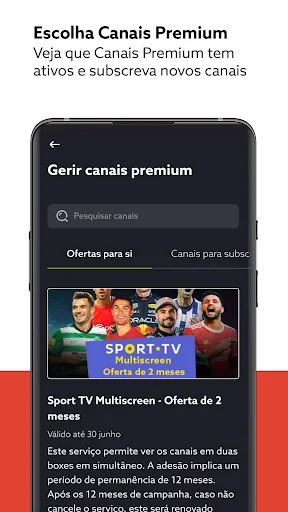
What the app looks like
Live screenshots from the Play Store, captured by our snapshot worker. Tap any image to enlarge.
my NOS's revenue trajectory
Forecast revenue from snapshot history. Last 2 months.
Where my NOS sits in Tools
Revenue distribution of 77129 comparable apps. my NOS highlighted.
my NOS vs comparable apps
Revenue trajectory side-by-side. Bold = my NOS, ghosted = peers.
App spec
Version
30.450
Last update
May 07, 2026
Launched
Jul 21, 2016
Price
Free
Monetization
Free
What my NOS actually does (from store listing)
With the new my NOS app, it's in your hands to save time and take care of everything in an instant, without calling or going to the store.
Now you can find everything that's important to you in the my NOS app, faster: check balances, top up, view and manage invoices or find exclusive benefits. And with the search function you will find what you are looking for in seconds.
Install the new my NOS app now and discover everything you can do:
• Consult and compare invoices, make payments;
• C…
With the new my NOS app, it's in your hands to save time and take care of everything in an instant, without calling or going to the store.
Now you can find everything that's important to you in the my NOS app, faster: check balances, top up, view and manage invoices or find exclusive benefits. And with the search function you will find what you are looking for in seconds.
Install the new my NOS app now and discover everything you can do:
• Consult and compare invoices, make payments;
• Control the consumption of data, minutes and SMS, check the balance and recharge the cell phone;
• Analyze communications details and manage extra internet packages;
• View customer account information, consult details of all contracted services and update contacts;
• Explore exclusive advantages and use the NOS Card for unique offers at NOS Cinemas.
After installation, log in with your NOS ID or register directly in the app. If you already use other NOS apps or websites, you can use the same access data to log in.
Find out more at nos.pt/infomynos
Comparable Android apps
The five apps in Tools with the closest revenue to my NOS. Click any to see its detail page.
Each forecast combines App Store rating, ratings count, monetisation model, pricing tier, IAP signals and ad-supported flag.
The base estimate is then multiplied by a per-category scaling factor learned from apps with founder-verified MRR.
Every number on this page comes from public APIs and bumetric's own snapshot history.
Full methodology covers input variables, accuracy bands per category and how we treat apps without comparable anchors.
See also the live data on my NOS's tracker page for current rating, reviews and snapshot timeline.
Building something similar? Get a free AI audit with $-revenue forecasts for every recommendation.

 GeckoVPN Unlimited Proxy VPN
 QTH Locator Pro
 Intra
Intra
 Simple Notes
 Database Modeler Pro