Android app
from Shimon Young : Play Home Software
· Casual
ML forecast★ 4.1 · 12KPaid
~9.2K/mo
ML revenue forecast.
Calibrated against 26282 apps in this category.
Confidence band
±15%
High — many comparable apps with verified data
At a glance
Earns 53.25× more than the category median (173/mo).
Ranks #51 of 26,282 in Casual (top 0.2% by revenue).
Launched May 08, 2012 · last updated Sep 02, 2025.
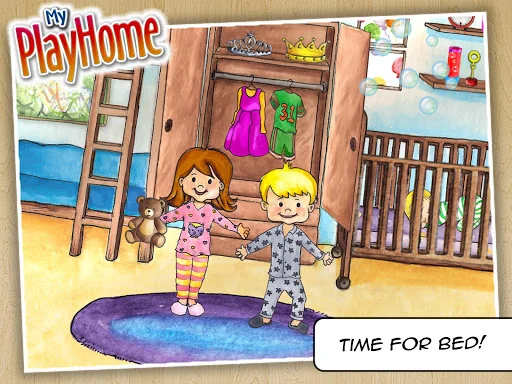
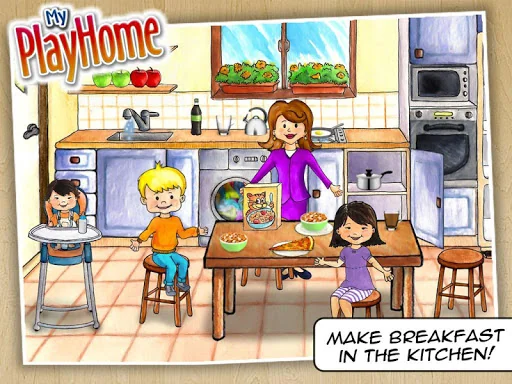
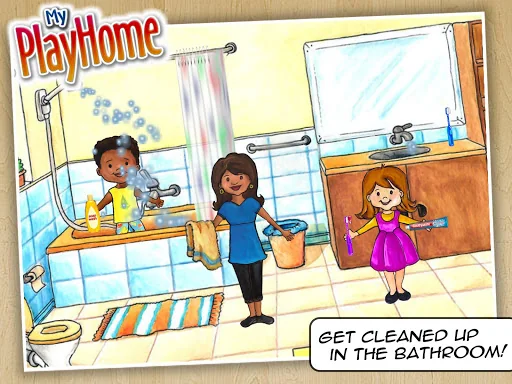
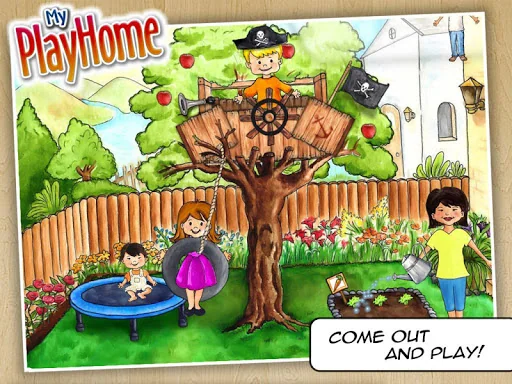
What the app looks like
Live screenshots from the Play Store, captured by our snapshot worker. Tap any image to enlarge.
My PlayHome's revenue trajectory
Forecast revenue from snapshot history. Last 1 months.
Where My PlayHome sits in Casual
Revenue distribution of 26282 comparable apps. My PlayHome highlighted.
My PlayHome vs comparable apps
Revenue trajectory side-by-side. Bold = My PlayHome, ghosted = peers.
App spec
Version
2.11.0.48
Last update
Sep 02, 2025
Launched
May 08, 2012
Price
$3.49
Monetization
Paid
What My PlayHome actually does (from store listing)
▶▶▶ OVER 10 MILLION MY PLAYHOME APP DOWNLOADS!!! JOIN THE FUN!
★★★ Featured in THE NEW YORK TIMES: Apps to Keep Children Happy
★ TOP 10 BEST KIDS APPS OF THE YEAR - Best Kids Apps
★ READERS' CHOICE AWARD THE YEAR - Best Kids Apps
★ READERS' TOP 10 THE YEAR - Smart Apps For Kids
★ Editor's Choice Award! - Children's Technology Review
★ Editor's Choice + Readers' Choice - Best Apps For Kids
-------------------------------------------------
My PlayHome is a doll house for the i…
▶▶▶ OVER 10 MILLION MY PLAYHOME APP DOWNLOADS!!! JOIN THE FUN!
★★★ Featured in THE NEW YORK TIMES: Apps to Keep Children Happy
★ TOP 10 BEST KIDS APPS OF THE YEAR - Best Kids Apps
★ READERS' CHOICE AWARD THE YEAR - Best Kids Apps
★ READERS' TOP 10 THE YEAR - Smart Apps For Kids
★ Editor's Choice Award! - Children's Technology Review
★ Editor's Choice + Readers' Choice - Best Apps For Kids
-------------------------------------------------
My PlayHome is a doll house for the iGeneration.
Imagine a doll house where your child can use everything, even the closets, TV and shower. Where you can fry an egg and feed the family pizza. Where you can pour drinks, blow bubbles and turn out the lights.
Imagine a doll house where the pieces are impossible to lose and never break. A doll house which grows over time and where new accessories and rooms are given to you for free.
Imagine if it was designed so that even a 2 year old could use it, yet detailed enough to entertain an 8 year old.
Imagine a doll house that could excite and captivate your children for hours for less than the price of a cup of coffee....
-------------------------------------------------
My PlayHome is the original and best dolls house app. Massively interactive, your kids can explore and use everything in the house. The characters eat, sleep, shower, brush their teeth and more. Want the room to be darker? Close the curtains! Fancy a change in music? Pop a different CD into the stereo!
No other doll house app comes close in interactivity, detail, ease of use and just plain fun!
-------------------------------------------------
★ NO ADVERTISEMENTS!
★ NO IN-APP PURCHASES!
-------------------------------------------------
Shimon Young is a member of Moms with Apps, a collaborative group of family-friendly developers seeking to promote quality apps for kids and families.
Ages: 1-3, 4-7
-------------------------------------------------
My Play Home on the web
http://www.myplayhomeapp.com/
http://www.facebook.com/playhome
http://twitter.com/myplayhomeapp
-----------------------------------------------
Remember! It's My PlayHome - not My Play Home or My Play House!
Comparable Android apps
The five apps in Casual with the closest revenue to My PlayHome. Click any to see its detail page.
Each forecast combines App Store rating, ratings count, monetisation model, pricing tier, IAP signals and ad-supported flag.
The base estimate is then multiplied by a per-category scaling factor learned from apps with founder-verified MRR.
Every number on this page comes from public APIs and bumetric's own snapshot history.
Full methodology covers input variables, accuracy bands per category and how we treat apps without comparable anchors.
See also the live data on My PlayHome's tracker page for current rating, reviews and snapshot timeline.
Building something similar? Get a free AI audit with $-revenue forecasts for every recommendation.
 Pirates and Traders: Gold!
 Air Control HD
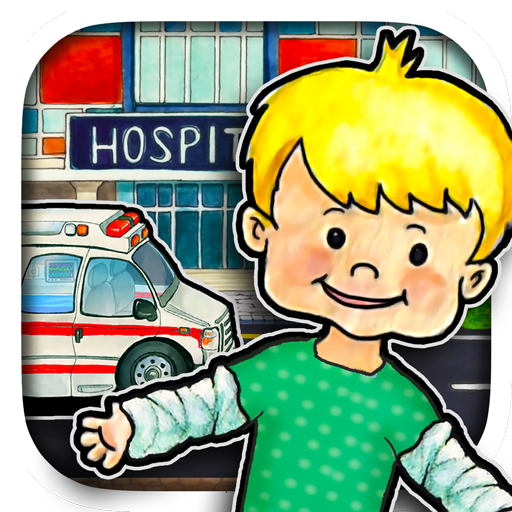 My PlayHome Hospital
 ゆけむり温泉郷
 당신을 기다리는 여우 花