ML revenue forecast.
Calibrated against 31082 apps in this category.
Confidence band
±15%
High — many comparable apps with verified data
At a glance
Earns 1.82× more than the category median (146/mo).
Ranks #5,473 of 31,082 in Shopping (top 17.6% by revenue).
Launched Mar 08, 2013.
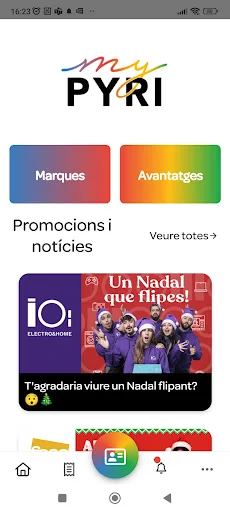
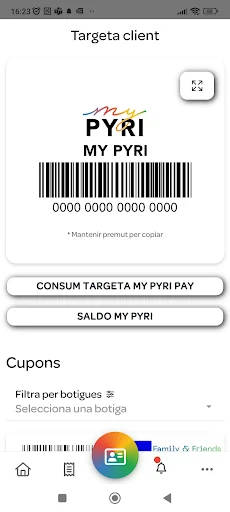
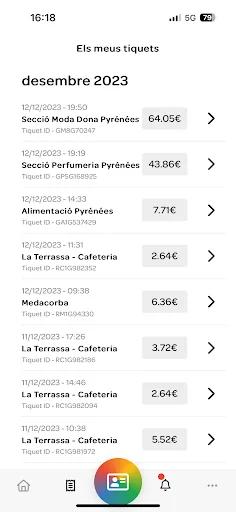
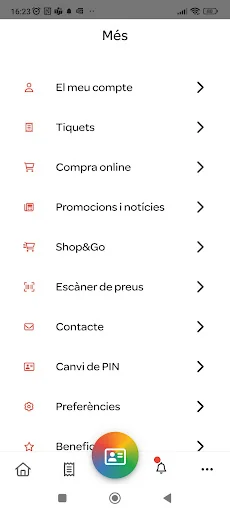
What the app looks like
Live screenshots from the Play Store, captured by our snapshot worker. Tap any image to enlarge.
My Pyri's revenue trajectory
Forecast revenue from snapshot history. Last 1 months.
Where My Pyri sits in Shopping
Revenue distribution of 31082 comparable apps. My Pyri highlighted.
My Pyri vs comparable apps
Revenue trajectory side-by-side. Bold = My Pyri, ghosted = peers.
App spec
Version
Varies with device
Launched
Mar 08, 2013
Price
Free
Monetization
Free
What My Pyri actually does (from store listing)
Welcome to My Pyri. Enjoy the advantages and discounts program of Pyrénées Andorra, Epizen (IO:Electro&Home, Iblú, Textura, Epizen Lab i Carrefour Epizen), Pyrénées Pas de la Casa, Carrefour City, K-Tuin, Brownie Illa Carlemany, Ofelia and MontBlanc Illa Carlemany.
Download this application for free, and get My Pyri totally free. In just 1 minute you will have in your hand the power to save every day with discount coupons, My Pyri balance, pay with My Pyri Pay card, exclusive offers and pr…
Welcome to My Pyri. Enjoy the advantages and discounts program of Pyrénées Andorra, Epizen (IO:Electro&Home, Iblú, Textura, Epizen Lab i Carrefour Epizen), Pyrénées Pas de la Casa, Carrefour City, K-Tuin, Brownie Illa Carlemany, Ofelia and MontBlanc Illa Carlemany.
Download this application for free, and get My Pyri totally free. In just 1 minute you will have in your hand the power to save every day with discount coupons, My Pyri balance, pay with My Pyri Pay card, exclusive offers and promotions, tickets in digital format and many more surprises.
Become a My Pyri member and enjoy the following benefits:
- Accumulate My Pyri Balance on all your purchases*.
- 2h free parking* at Pyrénées Andorra
- 5% direct discount at FNAC Entertainment
- Exclusive prices My Pyri
- And many more advantages!
*Discover all the advantages of My Pyri on the website www.mypyri.ad
__________________________
These are the functionalities of the My Pyri application:
- Purchase tickets
Use the digital ticket to make changes, returns, etc. and save paper.
- Check your My Pyri Balance
With My Pyri, you accumulate My Pyri Balance of all your purchases. Check your available balance in the app as well as all the history of the balance generated and changed.
- Discount coupons
Benefit from discount coupons by showing them at the checkout with your My Pyri card directly from the app.
- Find out about all the promotions and news from the centre.
- Price scanner
Check the price of any Pyrénées product by scanning the barcode. You can even find out if it is on sale.
- My Pyri Pay
Pay directly with your My Pyri Pay card (exclusive for Andorra residents).
- Shop & Go
(Exclusive to My Pyri Pay). No queuing, just scan the code from your full shopping cart and let us do the rest and we'll send it to you at home.
- Invoicing
(Exclusive to My Pyri Pay) Download your monthly invoices
- My Pyri Pay Card Consumption
(Exclusive to My Pyri Pay) Check the amount consumed in the current month over the limit of your My Pyri Pay card.
Comparable Android apps
The five apps in Shopping with the closest revenue to My Pyri. Click any to see its detail page.
Each forecast combines App Store rating, ratings count, monetisation model, pricing tier, IAP signals and ad-supported flag.
The base estimate is then multiplied by a per-category scaling factor learned from apps with founder-verified MRR.
Every number on this page comes from public APIs and bumetric's own snapshot history.
Full methodology covers input variables, accuracy bands per category and how we treat apps without comparable anchors.
See also the live data on My Pyri's tracker page for current rating, reviews and snapshot timeline.
Building something similar? Get a free AI audit with $-revenue forecasts for every recommendation.

 슈마루 - SHOEMARU
 테스트굿
테스트굿
 Price Tracker | Reprice
 Bonusway – Deals & Cashback
 USConnectMe