ML revenue forecast.
Calibrated against 48160 apps in this category.
Confidence band
±15%
High — many comparable apps with verified data
At a glance
Tracks close to the Android app category median (130/mo).
Ranks #13,498 of 48,160 in Business (top 28.0% by revenue).
Launched Apr 01, 2021 · last updated May 08, 2026.
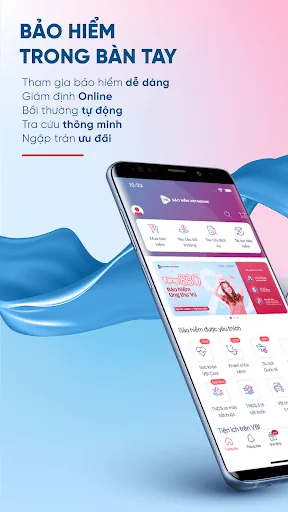
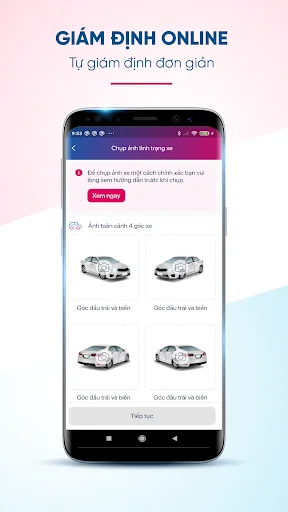
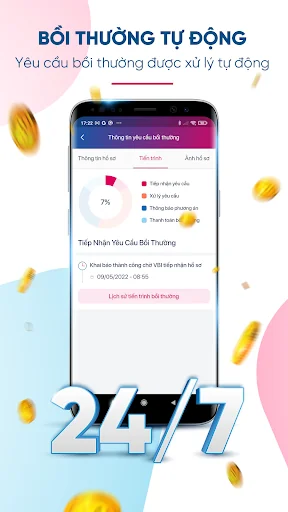
What the app looks like
Live screenshots from the Play Store, captured by our snapshot worker. Tap any image to enlarge.
My VBI's revenue trajectory
Forecast revenue from snapshot history. Last 1 months.
Where My VBI sits in Business
Revenue distribution of 48160 comparable apps. My VBI highlighted.
My VBI vs comparable apps
Revenue trajectory side-by-side. Bold = My VBI, ghosted = peers.
App spec
Version
1.0.58
Last update
May 08, 2026
Launched
Apr 01, 2021
Price
Free
Monetization
Free
What My VBI actually does (from store listing)
With the position of "Technology Pioneer", MyVBI brings superior benefits of artificial intelligence technology and machine learning. With 1 touch, customers experience the most advanced insurance technology and super-speed compensation service.
MyVBI integrates the smartest and latest insurance products, customers experience from purchasing, claim declaration, guarantee network lookup, ... in a completely different style and ensure transparency. white, absolutely safe.
Features of MyVBI A…
With the position of "Technology Pioneer", MyVBI brings superior benefits of artificial intelligence technology and machine learning. With 1 touch, customers experience the most advanced insurance technology and super-speed compensation service.
MyVBI integrates the smartest and latest insurance products, customers experience from purchasing, claim declaration, guarantee network lookup, ... in a completely different style and ensure transparency. white, absolutely safe.
Features of MyVBI Application
1. Buy Insurance online
2. Declaration of compensation and track the processing of compensation dossiers.
3. OCR scan to scan ID card, automatically fill information.
4. Simple, easy and convenient payment by ATM card, QR code, e-wallet and installment payment.
5. Look up convenient garage, clinic, hospital.
6. Update the latest promotions from VBI.
7. Many new features and utilities are currently being upgraded and developed.
EVERYTHING YOU NEED ABOUT INSURANCE - THAT IS AVAILABLE AT MYVBI APP
Each forecast combines App Store rating, ratings count, monetisation model, pricing tier, IAP signals and ad-supported flag.
The base estimate is then multiplied by a per-category scaling factor learned from apps with founder-verified MRR.
Every number on this page comes from public APIs and bumetric's own snapshot history.
Full methodology covers input variables, accuracy bands per category and how we treat apps without comparable anchors.
See also the live data on My VBI's tracker page for current rating, reviews and snapshot timeline.
Building something similar? Get a free AI audit with $-revenue forecasts for every recommendation.


 Apollo Quick Service
 ServeCircle
 Webex Intune
 Smartapp+
 Manokamana Gold